Chemical Education Journal (CEJ),
Vol. 12, No. 1 /Registration No. 12-3/Received September 20, 2008.
URL = http://chem.sci.utsunomiya-u.ac.jp/cejrnlE.html
Abstract
The purpose of this study was to investigate the effect of using pre-laboratory visualization resources as a technique combined with pre-laboratory assignments in teaching and learning general chemistry laboratory. The research was conducted during one year, three semesters. A comparison statistical analysis of the grades of both control and experimental groups showed that this technique is significantly better. t-test is higher than the critical values. Effect size indicates that the performance in this technique is more than 35 percentile points higher than the control group. Experimental groups of students gained better understanding of the concepts and had better technical-skills acquisitiveness. Based on the research findings, pre-laboratory visualization techniques are recommended to be used in combining with pre-laboratory assignments in teaching and learning general chemistry laboratory.
Key words: pre-laboratory visualization, pre-laboratory assignment, first-year undergraduate, general, chemical education,
Since 1970, CD-ROM began to appear in the literature ( Kempa, 1975; March, 2000). Pantaleo showed that videotapes shorten in-lab instruction (Palma, 1975). Russell, in 1985, did a comparison study between videotapes and videodiscs instructions in a freshman laboratory class and showed that using the videodisc as a pre-laboratory activity enhanced significantly the enthalpy experiment (Russell, 1985). The use of computer assisted learning (CAL) has also been reported in the determination of the percent oxygen in a sample of potassium chlorate (Moore, 1980); in four organic chemistry experiments (Wiegers and Smith, 1980).
In this study, pre-laboratory visualization techniques have been investigated. This paper starts with the statement of the problem followed by experimental description and design. Then, it highlights the data collection and evaluation, followed by discussion of the results.
Problem Statement
Here, at King Fahd University of Petroleum and Minerals (KFUPM),
pre-laboratory assignments have been used for along period of
time. However, it was noticed that students, either are not interested
or face difficulty solving the pre-laboratory questions, especially
questions related to the practical aspects. This can clearly be
attributed to the fact that students have not performed the experiment,
and have not seen the equipments or dealt with. Recently, there
was a shift into the pre-laboratory graded quizzes; however, there
was no significant improvement. To prepare students' minds for
learning new concepts as well as new skills, I believe that pre-laboratory
visualization techniques can be combined with this to help student
visualize the experiment and prepare their mind to perform the
experiment. Visualization plays a major role in science education,
in teaching and learning of science at any level in educational
systems.
Laboratory Description
The general chemistry course at KFUPM is designed for most
freshmen, science and engineering majors. The control and experimental
laboratory groups were designed to give students pre-laboratory
assignments and graded quizzes.
Viewing Procedure
In the experimental groups only, students were given access
into the WebCT in which videos, photographs, pictures and some
brief instructions of each experiment were uploaded, consecutively.
Students were asked to review the material and prepare to have
a quiz and to perform the experiment. On the other hand, students
of control groups were not given access.
Design of the Survey Form
The survey forms were designed in three parts. In the first
part, students were asked if this technique was complementary
to pre-laboratory exercises. Also, they were asked how this technique
effected there performance. In the second part, they were asked
if this technique was helpful in preparation and performance.
In the last part, they were asked in which stages of the lab work
this technique can be preferable used.
Data Collection
Data collection was designed to provide information about
academic performance of both control and experimental groups.
In addition, questionnaires were distributed to experimental-students.
Excel and MINITAB software were used for analyses.
Evaluation
The evaluation of the pre-laboratory visualization learning
techniques consisted of two parts: the statistical comparison
analysis of the quizzes and report sheets grades of the experimental
and control groups during two semesters, and the other part is
the analysis of students' attitudes.
Results and Discussion
The goal of the pre-laboratory visualization techniques was
to prepare students for the laboratory experiments. To measure
the effectiveness of this strategy, a comparison was conducted
between the laboratory performance of the pre-laboratory visualization
users (experimental group) with the performance of sections
of students who had not used pre-laboratory visualization resources
(control group). The pre-laboratory visualization users
did significantly better on the pre-laboratory written quizzes,
the experiments and the final (Table 1).
This is clear from the statistical results; t-test is higher than
the critical value in the three parts. P-values are less than
0.05. In addition, we calculate the effect size (Bowen,
2000) for the three parts according to the following equation:
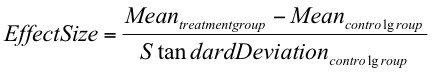
The effect size indicates that pre-laboratory visualization techniques can significantly enhance student efficiency and understanding. An effect size of 1.15 (Table 1), means that median students' performance is significantly improved from the 50th percentile in the control sections, to approximately 87th percentile in the pre-laboratory visualization users (Table 2).
Table 1. Statistics on Pre-laboratory
Visualization Achievement
| Experimental Group | Control Group | Statistical Values | |||||
| Mean | S.D. | Mean | S.D. | t-test (critical value at P= 0.05) | p-value | Effect size* | |
| Written Quizzes | 70.4 | 1.3 | 68.6 | 1.7 | 10.1 (3.18) | 0.002 | 1.05 |
| Experimental Reports | 87.1 | 2.91 | 78.9 | 7.13 | 3.69 (2.22) | 0.004 | 1.15 |
| Final | 89.3 | 2.7 | 84.0 | 3.9 | 4.42 (3.18) | 0.02 | 1.36 |
Table 2. Effect Sizes and Percentile
Changes between Treatment and Control Groups
|
|
|
|
1.3 1.2 1.1 1.0 0.8 0.6 0.4 0.2 0.0 |
90 88 86 84 79 73 66 58 50 |
Students were asked to fill out survey forms that included
statements to which they could agree or disagree. When asked how
they found pre-laboratory visualization recourses, students agreed
that pre-laboratory visualization was a good tool to solve pre-laboratory
exercises and graded quizzes (Table 3.).
They agreed also that pre-laboratory visualization was a good
tool to prepare students' minds for learning new concepts as well
as physical skills. It was a good technique by which motivation,
efficiency and effectiveness of students were increased. They
agreed also that this technique demonstrated a set of technical
observations in interesting way. Students could review the resources
at any time at any place. When they were asked how pre-laboratory
visualization recourses helped them, students agreed that pre-laboratory
visualization helped them better acquire technical skills, and
to avoid laboratory accidents (Table 4.).
Table 3. Students' Responses
to How they Found Pre-Laboratory Visualization:
| I found that pre-laboratory visualization resources: | % A | % D | |
| 1. | were complementary to pre-laboratory exercises | 85 | 15 |
| 2. | gave me some sort of excellent mental preparations | 100 | 0 |
| 3. | improved my performance , skills and abilities | 82 | 18 |
| 4. | increased my independence and motivation | 67 | 33 |
| 5. | increased the efficiency and effectiveness of discussion | 85 | 15 |
| 6. | were a good tool to demonstrate a set of observations | 79 | 21 |
| 7. | presented experiments within an interesting context | 79 | 21 |
| 8. | gave chance to review the material at home, at any time that is appropriate to me | 100 | 0 |
Table 4. Students' Responses
to How Pre-laboratory Visualization Helped them:
| I believe that pre-laboratory visualization resources helped me: | % A | % D | |
| 1. | prepare for the quizzes and experiments | 85 | 15 |
| 2. | understand the experiments' contents | 79 | 21 |
| 3. | reduce down the fair and hesitate dealing with the experiments and chemicals | 67 | 33 |
| 4. | understand how to conduct the experiment | 73 | 27 |
| 5. | perform accurate measurements | 79 | 21 |
| 6. | understand how to use some chemical equipments | 76 | 24 |
| 7. | understand the safety regulations | 85 | 15 |
| 8. | follow the recommended precautions | 79 | 21 |
Table 5. Students' Responses
to How Pre-laboratory Visualization Can be Used:
| How can pre-laboratory visualization be used? | % A | % D | |
| 1. | As a preparation prior to students practical | 94 | 6 |
| 2. | As a preparation tool prior to an instructor demonstration | 91 | 9 |
| 3. | As tools that help students solving the pre-laboratory exercises | 79 | 21 |
| 4. | As a substitute for an experiment due to student's absence. | 53 | 47 |
| 5. | As a revision resource since they can be revisited quickly as many times as I wish and at a time and place convenient to me | 94 | 6 |
| 6. | As a plenary when the experiment has not been successful in yielding the expected observations. | 70 | 30 |
| 7. | As tools for the safety regulations and recommended precautions | 82 | 18 |
| 8. | As tools for the exam preparation | 73 | 27 |
As to how pre-laboratory visualization can be used, students agreed that pre-laboratory visualization can be an excellent way to prepare for the experiments and exams, to understand safety regulations and recommended precautions (Table 5.). It is helpful when students have failed to complete the practical work, or have had insufficient time to understand the concept of what takes place. Sometimes, practical work does not yield the expected results or observation for one reason or another. In such cases pre-laboratory visualization techniques can be a useful tool to demonstrate perfect observations. In other cases, students can catch up experimental work when they have missed the laboratory due to absence. From a "safety" point of view, pre-laboratory visualization techniques can be a good way for students to learn. Since good laboratory practices are observed, the recommended precautions can be followed.
As a result of the availability of pre-lab resources, students can visualize the experiment before lab attendance. This gives them good idea of how to perform the experiment and lead to improve creativity and analytical thinking.
References
Bowen, Craig W. (2000). "A
Quantitative Literature Review of Cooperative Learning Effects
on High School and College Chemistry Achievement" J. Chem.
Educ., 77, 116- 120.
Cohen, J. (1988). Statistical power analysis for the behavioral sciences (2nd ed.). Hillsdale, NJ: Lawrence Earlbaum Associates.
Fleming, F. F. (1995). "No Small Change: Simultaneously Introducing Cooperative Learning and Microscale Experiments in an Organic Lab Course" J. Chem. Educ., 72, 718.
Jacobsen, J. J.; Jetzer, K. H.; Patani, N.; Zimmerman, J.; Zweerink, G. (1995). "Propylene Oxide Addition to Hydrochloric Acid: A Textbook Error" J. Chem. Educ., 72, 612-613.
Kempa, R. F.; Ward, J. F. Br. (1975). "The effect of different modes of task orientation on observational attainment in practical chemistry" J. Educ. Technol, 5, 62-71.
March, J. L.; Moore, J. W.; Jacobsen, J. J. (2000). "ChemPages Laboratory: Abstract of Special Issue 24 on CD-ROM" J. Chem. Educ., 77, 423-424.
Moore, C.; Smith, S.; Avner, R. A. (1986). "Facilitation of laboratory performance through CAI" J. Chem. Educ., 57, 196-198.
Oxendine, J. B. (1968) "Psychology of Motor Learning" Appleton-Century- Crofts: New York.
8Palma, R. J. (1975). "A technique-oriented freshman laboratory program" J. Chem. Educ., 52, 116-117.
Pickering, M. (1987), "What goes on in students' heads in lab?" J. Chem. Educ. 64, 521-523.
Russell, A. A.; Staskun, M. G.; Mitchell, B. L. (1985). "The use and evaluation of videodiscs in the chemistry laboratory" J. Chem. Educ., 62, 420-422.
Wiegers, K. E.; Smith, S. G. (1980). "The use of computer-based chemistry lessons in the organic laboratory course" J. Chem. Educ., 57, 454- 456.
Zimmerman, J.; Jacobsen, J. J. (1996). "Quantitative Techniques in Volumetric Analysis" J. Chem. Educ., 73, 1117.
References (in the order of appearance)
1. Oxendine, J. B. (1968) "Psychology of Motor Learning"
Appleton-Century- Crofts: New York.
2. Pickering, M. (1987), "What goes on in students' heads in lab?" J. Chem. Educ. 64, 521-523.
3. Jacobsen, J. J.; Jetzer, K. H.; Patani, N.; Zimmerman, J.; Zweerink, G. (1995). "Propylene Oxide Addition to Hydrochloric Acid: A Textbook Error" J. Chem. Educ., 72, 612-613.
4. Zimmerman, J.; Jacobsen, J. J. (1996). "Quantitative Techniques in Volumetric Analysis" J. Chem. Educ., 73, 1117.
5. Fleming, F. F. (1995). "No Small Change: Simultaneously Introducing Cooperative Learning and Microscale Experiments in an Organic Lab Course" J. Chem. Educ., 72, 718.
6. Kempa, R. F.; Ward, J. F. Br. (1975). "The effect of different modes of task orientation on observational attainment in practical chemistry" J. Educ. Technol, 5, 62-71.
7. March, J. L.; Moore, J. W.; Jacobsen, J. J. (2000). "ChemPages Laboratory: Abstract of Special Issue 24 on CD-ROM" J. Chem. Educ., 77, 423-424.
8. Palma, R. J. (1975). "A technique-oriented freshman laboratory program" J. Chem. Educ., 52, 116-117.
9. Russell, A. A.; Staskun, M. G.; Mitchell, B. L. (1985). "The use and evaluation of videodiscs in the chemistry laboratory" J. Chem. Educ., 62, 420-422.
10. Moore, C.; Smith, S.; Avner, R. A. (1986). "Facilitation of laboratory performance through CAI" J. Chem. Educ., 57, 196-198.
11. Wiegers, K. E.; Smith, S. G. (1980). "The use of computer-based chemistry lessons in the organic laboratory course" J. Chem. Educ., 57, 454- 456.
12. Bowen, Craig W. (2000). "A Quantitative Literature Review of Cooperative Learning Effects on High School and College Chemistry Achievement" J. Chem. Educ., 77, 116- 120.
13. Cohen, J. (1988). Statistical power analysis for the
behavioral sciences (2nd ed.). Hillsdale, NJ: Lawrence Earlbaum
Associates.