2Science Education Center, Srinakharinwitrot University, Thailand
3Faculty of Science, Mahidol University, Thailand
*Email: bhinyop
Chemical Education Journal (CEJ), Vol. 15 /Registration No.
15-3/Received November 4, 2013.
URL = http://chem.sci.utsunomiya-u.ac.jp/cejrnlE.html
Abstract
High achieving secondary students with very limited exposure
to hands-on activities were taught by a guided inquiry laboratory
to carry out their experiments to obtain the initial rates in
the Landolt reaction with respect to [IO3-]0 and [HSO3-]0 and the activation energy of the IO3-
+ HSO3- reaction. A pH meter
was used to follow progress of the reaction. Students felt more
comfortable when provided with the datalogger to work with the
pH meter. The values of activation energy obtained by them varied
over such a wide range that they began to recognize the importance
of experimental skills and the tool used to measure temperature.
Students developed their concepts and ideas through a 5E inquiry
lesson. They learned to investigate by hands-on activities and
construct their explanations within their groups and with the
class. Students could develop their knowledge on chemical kinetics,
effects of concentration and temperature, rate law equation, and
activation energy. Evidence for students' knowledge improvement
can be seen in the high percentage gain. These findings suggest
the usefulness of meaningful activities in the learning unit in
enabling students to connect experimental data with scientific
concepts and ideas. Apart from showing positive attitude toward
the laboratory the students gained manipulative and procedural
skills. They also acquired a more realistic perception of the
micro aspect of chemical reactions.
Keywords: Kinetics, pH, Landolt Reaction, Inquiry-based,
Computer-Based
3.1.1 Determination of the order of reaction
3.1.1.1 Order of reaction with respect to IO3- based on the isolation method
3.1.2 Determination of the activation energy of the reaction
4.1 Science Experimental Result
4.1.1 Order of reaction with respect to IO3-
4.1.2 Order of reaction with respect to HSO3-
4.1.3 Determination of the activation energy of the reaction
The literature has shown that the chemical clock reaction is fascinating to secondary and tertiary students [1-2], especially, with its relevance to the biological cycle. Chemical kinetics based on color change of some clock reactions have long been used for student laboratories and demonstrations [3-12]. We were fortunate to have worked with highly motivated high-school students some of whom had passed the advanced placement chemistry examination. However, these students who had been taught conventionally to solve kinetics problems based on written equations and mathematics had little or no idea as to how experiments should be carried out to derive the reaction rate and the activation energy. As a result this topic of chemistry appeared abstract to them; thus they usually obtained kinetics parameters with very little feeling for the concrete physical implications [13-16]. This type of situation has been also found in freshmen of many colleges and universities in this country.
The aim of this study is to enhance student understanding of the effects of reactant concentration and temperature on reaction rate by learning through guided inquiry learning unit which involves experimentation. We thus designed a series of experiments based on the Landolt reaction
for our grade-eleven students as part of a guided-inquiry instruction on the topic. Groups of students worked cooperatively in obtaining the initial rate, order of reaction and activation energy by following changes in pH with time. They were subsequently expected to arrive at the realization that good kinetic parameters can only be derived from carefully planned and executed experiments, and also from judicial interpretation of the data obtained. Students' were assessed for their understanding by pretest and posttest. They were asked to write the experimental report and journal. They also showed their opinion for the lessons via questionnaire and interview.
This success was due to the design of both laboratory experiment and the integration of the experiment into an inquiry approach. In an experiment on the Landolt reaction
the students were engaged by a demonstration of a clock reaction involving pH changes to their school's colors (blue and yellow). Analytical grade potassium iodate (KIO3) and sodium hydrogen sulfite (NaHSO3) were used to give iodate and bisulfite ions. Sodium hydrogen sulfite was freshly prepared. A pH meter was used to monitor the decrease in the pH due to production of hydronium ions in the reaction. A temperature probe was also placed near the tip of the pH electrode. A datalogger (data harvest easysense advanced model) was used to interface between the probes (pH and temperature) and a notebook computer to record pH change versus time. The reaction was started by rapid mixing of the reactants with a magnetic bar in a beaker sitting in another temperature-controlled water vessel. The chemicals, apparatuses, glassware etc. could be easily obtained from local suppliers.
3.1.1 Determination of the order
of reaction
3.1.1.1 Order of reaction with
respect to IO3- based on the
isolation method
The students started the reaction by adding 25.0 mL of 0.002 M
sodium hydrogen sulfite solution to a 100 mL reaction beaker containing
at one time one concentration of the following: 0.04, 0.08, 0.12,
0.16, 0.20 M potassium iodate solution, with constant mixing by
a magnetic stirrer. At each reactant ratio the reaction temperature
was kept constant throughout. Data (pH change) were logged into
a PC notebook for subsequent display and conversion to [H+].
Each group was expected to accomplish with at least four concentrations
of IO3-. Before mixing was started
the pH of the IO3- solutions
was kept between pH 5.5-6.0.
The values of pH over the first five seconds had to be converted
into [H+] by the students and the initial rate was
expressed in terms of the slope of Δ [H+] / time.
The order of the rate law k'[IO3-]a
where k' is the rate constant and a is the order of reaction
with respect to iodate ion, obtained at [IO3-]
>> [HSO3-] was used in
the experiment. The linear equation for the pseudo-order rate
equation is:
The slope of the graph between ln rate versus ln [IO3-] plotted by the students yielded the order of the reaction.
For this experiment students were asked to find out the reason for pseudo-order approximation. They were made to realize that determining the order of reaction with two or more reactants is difficult. If one reactant is set to be at a constant concentration in excess for example in this following experiment we set [IO3-] in excess of [HSO3-] for all experiments. Changing the initial concentration of each reactant can give the order of reaction with respect to that reactant whose concentration is changed.
3.1.1.2 Order of reaction with
respect to HSO3-
For reason of time limitation this experiment was performed by
the instructor. The reaction was started and carried out as in
3.1.1.1 only this time [IO3-]0 was at 0.05 M and the [HSO3-]0 varied from 2.5x10⁻³ to 6.25x10⁻⁴
M. The order of reaction was obtained by the slope of the double
log plot. After students determined the order of reaction with
respect to iodate and bisulfite ion they could find out rate constant
of the reaction (k) by substituting the value of reaction
rate at a concentration of either reactant using the rate law
equation.
3.1.2 Determination of the activation
energy of the reaction
The same procedure was used as in part I, the starting volumes
and concentrations were 25.0 mL of 0.02 M KIO3
and 25.0 mL of 0.01 M NaHSO3. Students
followed the initial rate of pH change, to be converted to Δ[H+]
versus time at controlled temperatures ranging from 283.15 K (10
°C) to 333.15 K (60 °C).
The Arrhenius equation
was used in the replotting of
which yielded a slope with the value of Ea/R in kJ/mol. Then students got Ea by substituting the slope of their graph into the equation:
A in Arrhenius equation stands for frequency factor, k is the rate constant, Ea is an activation energy in the unit of kJmol-1, R is the gas constant in the unit of J/mol K and T is the absolute temperature.
3.2.1 Guided Instruction This study succeeds in using 5E inquiry strategy [17-18] to develop the learning unit to promote students' understanding on chemical reaction rate, rate law and activation energy. The demonstration of iodate sulfite thiosulfate system was used in the engagement step. The instructor, before the experiment, guided the students into developing their own concepts involved and working the concentrations used in each experiment. Then the students had opportunity to conduct two hands-on activities on the effects of concentration and temperature on the reaction rate to obtain their own evidence in the exploration step. Afterwards, students were also able to convert the pH change into Δ[H+] and plotted their graphs under the teacher's minimum guidance. Students used their own data to discuss with peers for explanation. In the last step on evaluation, the students presented their experimental results, concluded and interpreted their results. They also elaborated on their idea by applying their knowledge to other situations posed by other students and instructors.
3.2.2 Assessment of students' learning and attitude Student understandings were evaluated by pretest and posttest questions which had passed the approval of three experts in chemistry and chemical education. A t-test analysis was employed. Student attitudes toward the guided-inquiry unit were explored by a questionnaire with scoring on a 5-point Likert scale (high satisfaction = 5).
The topics for learning and assessment were concentration and temperature effects on reaction rate, order of reaction and rate law equation, and application of the Arrhenius equation. Students were asked such questions as: How would you determine the reaction rate of the reaction between calcium carbonate and hydrochloric acid by a convenient method? Explain why you have to use this method. Students had to have scientific knowledge and skills for choosing an appropriate way to monitor the reaction. An example for concentration and temperature that affect reaction rate is:- what would happen to the reaction rate of the reaction between sodium carbonate and hydrochloric acid when the temperature is increased, water is added and each reactant concentration is increased. An experimental result in a reaction between iodide and peroxydisulfate ion was shown and students were asked to identify the method for rate law determination and why they had to use a very high concentration of iodide than peroxydisulfate. Students would have the right answer if they could understand why they had to resort to a pseudo-method experiment.
Students evaluated their perception on this learning unit in terms of understanding, manipulating and inquiry skills by responding to the eighteen items in a questionnaire. Some the questions are:
1) After having done the experiment can you use your own experimental data to determine the effect of reactant concentration on chemical reaction rate to obtain the rate law and order of reaction?
2) Did the experiment on the effect of temperature on chemical reaction rate enhance your conceptual understanding of this topic?
3) Did the use of datalogger for collecting the data make you more comfortable in doing this experiment?
4) Could you use the experimental data for supporting your explanation of the phenomenon?
5) Did you have problems in controlling the temperature of the reaction?
6) Did you feel frustrated in not knowing whether the answer was right or wrong?
Students responded to the above by scoring on the Likert scale. (See 4.2.4 in Results)
This study was carried out at a public science school in Thailand. The students were gifted and talented in science, mathematics, and technology. The participants were from two classes of grade 11 science students (N = 46). They participated in the one month chemical kinetics lesson (3 periods / week). The students worked in groups of four. The results are shown in science part and educational part as follows.
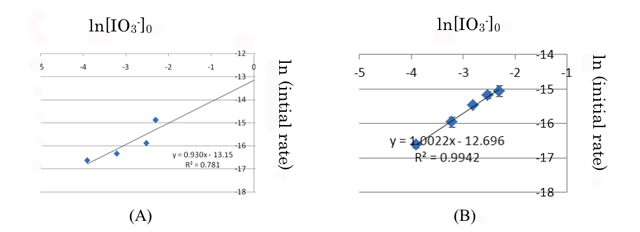
4.1.1 Order of reaction with respect to IO3- At 30 - 31 °C and [IO3-]0 / [HSO3-]0 ratios from 100 : 1 to 20 : 1 (initial iodate concentration varied from 0.1 M to 0.02 M at 0.001 M of initial hydrogen sulfite concentration) the linear slopes of Δ[H+] / time (mol L-1s-1) the reaction was pseudo-first order with respect to iodate (Figure 1).
Class results from the double logger plot were linear giving a slope of 1.006, interpreted by them as 1. However, the scatter in their result (Figure 1A) was much higher than the instructor's (Figure 1B).
4.1.2 Order of reaction with respect to HSO3- For calculating the order of the rate law k'[HSO3-]b, the linear equation for the pseudo order rate equation used was
The concentrations of [HSO3-]0 varied from 5.0 x 10⁻³ to 6.25 x 10⁻⁴ M while [IO3-]0 was held at 0.05 M. Results (data not shown) from double log plot were linear giving a slope of 1.985. Thus the order of reaction with respect to HSO3- was found to be 1.985, interpreted as 2.
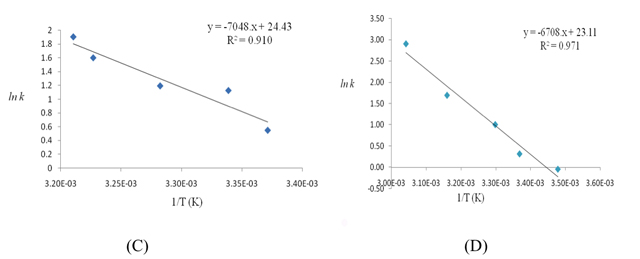
4.1.3 Determination of the activation energy of the reaction Replotting the log velocity of reaction against 1/T (degree Kelvin) at 0.01 mol/dm3 [IO3-]0 to 0.005 mol/dm3 [HSO3-]0 and temperature ranging from 0-60 °C, the whole class obtained from the linear slope a value of 92.87 ± 39.75 kJ/mol for the activation energy. An example of students' results is shown in Figure 2.
The students' scores were analyzed by using paired two samples t-test. There was significant difference (p < 0.0001) between total pretest and posttest scores and in each topics of the test (average of pretest = 6.54 and posttest = 19.96 out of 25). They showed relatively high satisfaction for the laboratory as the average score in the Likert scale was 3.89 (S.D. 0.67).
4.2.1 Students' laboratory report To assess the effectiveness of the learning unit, students' laboratory reports were also evaluated. The laboratory reports were graded by rubric scoring of five components: hypotheses, quality of the observation/data, graph, calculations, and conclusion from the experiment [19]. The laboratory report scores in Table 1 showed that the quality of five aspects of the report were at exemplary level for all aspects.
| Criteria | The effect of concentration on reaction rate | The effect of temperature on reaction rate |
|
1. Hypothesis (5 points) |
4.74 ± 0.44 | 5.00 ± 0.00 |
|
2. Quality of the observations / Data (5 points) |
4.70 ± 0.46 | 4.83 ± 0.38 |
|
3. Graph (5 points) |
3.94 ± 0.84 | 4.04 ± 1.18 |
|
4. Calculation (5 points) |
4.74 ± 0.49 | 4.43 ± 0.54 |
|
5. Forms a conclusion from the experiment (5 points) |
3.91 ± 0.95 | 4.30 ± 0.75 |
|
6. Total (25 points) |
22.04 ± 2.01 | 22.60 ± 1.73 |
4.2.2 Students' journal The data from students' journal were used to support other results from conceptual test, laboratory report and students' opinion. In summary, results from students' journal supported that students understood the main concepts of the chemical reaction rate activities. They understood the main ideas that higher reactant concentration and high temperature would lead to higher reaction rate. The hands-on activities helped students construct scientific knowledge on rate law and apply the Arrhenius equation. They used collision theory or rate law and Arrhenius equation for their explanation. Students voiced that they could then construct the knowledge by changing their learning style from the traditional way to inquiry. They commented that doing hands-on experiments and using the results for constructing their scientific knowledge made the experiments more meaningful. The experimental results provided some background for arriving at scientific knowledge and thus they felt comfortable in drawing scientific concepts from their experimental results.
4.2.3 Pretest and Posttest The parallel pretest and posttest were used for investigate students' conceptual understanding before and after completing the learning unit. The topics in these tests are concentration and temperature affect on reaction rate, order of reaction and rate law equation, and application of Arrhenius equation. The students' scores were analyzed by using paired t-test. There was significant difference (p < 0.0001) between total pretest and posttest scores in each topic of the test and over all topics. Eighty-two percents of students got the right answers on the test items about concentration and temperature affect on reaction rate and applying of Arrhenius equation while seventy-six percents of them have the correctly answer on the order of reaction and rate law equation for the posttest.
4.2.4 Students' questionnaire Students' attitude toward the guided-inquiry learning unit was explored by a five-scale Likert questionnaire (strongly agreement = 5). The lowest score of students' opinions were for difficulty in preparing different concentrations of reactant and controlling the various temperatures of the reaction. The availability of reagents and equipment, and the use of datalogger received highest satisfaction score. The main constraint of this laboratory unit was insufficient time. Comments from students were, for example, about fifteen percent of students suggested that instructors should explain certain aspects before asking students to do the experiments, lecture should come before experiment. Four percent of students also thought the scientific concepts in this learning unit were difficult and the activities complicated. Nevertheless, ninety eight percent of them liked the hands-on activities and wanted to do more experiments. Most students had positive attitude on the teaching strategy of this guided-inquiry learning unit.
It is possible to write the rate law of the following Landolt reaction
as
Csekõ, Varga, Horváth and Nagypál [20] reviewed in their report the rate law of the Landolt reaction as follows:
for the Landolt reaction that does not depend directly on [H+] condition. Thus the little initial pH change should not affect the rate of reaction.
We estimated that during the first five seconds of the reaction generally less than 2% of the limiting reactant was consumed [21]. It is expected then that during this period of time the subsequent competing Dushman reaction
was negligible. The orders of reaction obtained by us agree with those reported in the chemistry literature [20]. However, discrepant orders for HSO3- at different pH conditions were found. There is an interesting report of a student laboratory on kinetics of the Landolt reaction based on following iodine change spectrophotometrically [22] which differs from another [10] which was based on iodine-starch complex formation. One big advantage of using the pH meter in monitoring the reaction rate is that the meter can easily follow the reaction, rapidly and digitally. This apparatus is cheaper than the spectrophotometer and can be hand carried. Besides students got to learn to convert ΔpH into Δ[H+].
The students' activation energy values varied over a wide range which is attributable to their lack of laboratory skills. For some uninitiated students it was the first time they carried out such a manually demanding experiment. In the instructor's hands the average value is 56 kJ/mol. Students learned that good data and parameters are not easy to obtain unless one has the proper tool and experimental skills. For example a better value of activation energy should come from doing the experiment in a thermostated cell with a magnetic stirrer. Nevertheless this experiment helped the students understand how to determine activation energy and make the lesson more meaningful than just getting the data from textbooks.
From these two experiments on the effects of reactant concentration and temperature on reaction rate students could derive the initial rate, order of reaction and activation energy by themselves. They also came to realize that good kinetic parameters can only be derived from carefully planned experiments, and judicial interpretation of the data obtained. Moreover because these experiments used the basic apparatus and chemicals, one could set the experiment for mobile learning or develop it to be part of an experimental package.
After going through the learning unit, the students were able to develop their own knowledge on several aspects of chemical kinetics, e.g., effects of concentration and temperature, rate law equation, and activation energy. Evidence for their increased knowledge can be seen in high percentage gain. These findings suggested the use of meaningful activities of the learning unit in enabling the students to connect experimental data with scientific concepts and ideas. The students had to find the order of reaction and activation energy by calculating from their own experimental data, instead of using information from textbooks as in traditional teaching. Results from students' journal supported that they understood the principal idea that higher reactant concentration and high temperature would lead to higher reaction rate. They used collision theory and/or rate law and Arrhenius equation for their explanation. Students voiced that they could then construct knowledge by changing their learning style from the traditional to an inquiry one. They commented that doing hands-on experiments and using the results for constructing their scientific knowledge made the experience more meaningful. The experimental results provided some background for understanding of how scientific knowledge comes about and thus they felt comfortable in drawing scientific concepts from their works. These findings are similar to previous studies [23-27] that providing students the opportunity to inquiry laboratory experiments resulted in significant benefits to the students' understanding.
In this study, students not only developed good conceptual understanding but they also learned how to work collaboratively during the learning activity. For the first time the students were able to use raw laboratory data and convert them to determine rate law, order of reaction and the activation energy. Apart from gaining procedural and manipulative skills, the students learned to follow pH change versus time and convert the pH values of hydronium ion concentrations before obtaining the initial rate. Some students were overly concerned about their experimental results which might be far from the established ones because they were not accustomed to obtaining values not provided to them by the teacher. All of them, nevertheless, were happy with the ensemble of the pH meter and the datalogger. The main constraint of their laboratory unit was insufficient time.
This work was supported by Mahidol Wittayanusorn School. The authors wish to thank Sarote Boonseng, Soontorn Pornjumreon and Dr. Ekasith Somsook for comments and suggestions.