2 Department of Chemistry and Biochemistry, Miami University Center for Nanotechnology, Miami, USA.
3 Department of Chemistry, College of science, University of Kufa, P.O. Box (21), Najaf Governorate, IRAQ.
E-mail: nasserhassan1977
Chemical Education Journal (CEJ), Vol. 16/Registration No.
16-103/Received January 8, 2014.
URL =http://chem.sci.utsunomiya-u.ac.jp/cejrnlE.html
Abstract
Reproducible timing in flow injection makes it unnecessary
for both physical and chemical equilibrium to be attained in the
processes involved. Reproducibility of results is largely and
principally related to reproducible timing. On the other hand,
the batch method and classical air-segmented continuous flow analyzers
deal with the physical and chemical equilibrium processes in a
similar manner. Consequently, they both require that steady state
signals are used to obtain reproducible results.
Key Words: Flow Injection, Air Segmented Continuous
Flow, Physical Equilibrium.
2. Automated Analysis In General
3. From Beaker To Continuous Analysis; Batch methods
4. Automated Continuous Flow Methods
Flow injection analysis is more than an analytical technique. Essentially it is a technology that provides a platform for the use of most analytical techniques and methods and presents a modes operand that promotes reproducibility, speed, flexibility and ready automation whilst being simple in operation and relatively inexpensive. These features have endeared the concept of flow injection analysis to researchers worldwide over the last thirty years.
Automatic methods applied to the analysis of series of samples can be grouped into three categories, namely batch, robotic, and continuous-flow methods. Flow injection (FI) methods fall into the last category. FI is a special mode of continuous analysis in which there are no bubbles separating the transport and/or reaction zones of samples successively introduced into the FI analyzer. In short, FI has four essential features: (1) unsegmented flow, (2) direct insertion, (3) controlled partial dispersion, and (4) reproducible operational timing [1,2].
Automation is commonly employed to reduce the manpower costs of laboratory operations. The need for high sample throughput is another major reason for automation. Additionally, automation equipment is used in situations which are too hazardous for human exposure. For example, the measurement of analytes in radioactive samples is more easily carried out under automated conditions, thereby eliminating concerns over occupational safety [3].
Let us examine batch methodology. To start, there is nothing wrong with batch chemistry methods. In fact, many of the current automated methods are based on previous batch methods. Batch methods were designed to maximize precision and accuracy and few had to be used in situations where large numbers of determinations per day were needed. These methods require highly skilled chemists to carry out the individual tasks.
Figure 1 depicts a typical batch process. A known amount of sample (S) and analytical reagent (R) are brought together into a common beaker. This actual physical pouring or addition by pipetting is not critical to the reproducibility of the chemical system.
However, the establishment of the chemical equilibrium
has two major components, physical mixing and chemical kinetic rates.
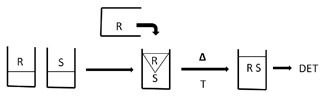
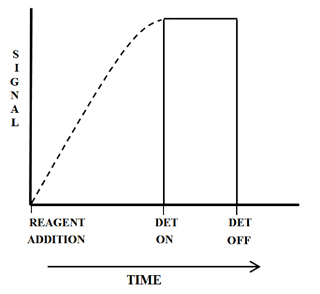
Figure 2 is a plot of the observed signal for a batch method. The plot of signal versus time is represented by a broken and then a solid line. The broken line is the best estimate of the signal that would be observed if it could be measured. In batch methods the agitation of the sample makes the actual measurement of the points on the broken section of the plot impossible. Even if the sample could be measured, the irreproducible physical mixing would make the reproducibility of the signal unacceptable. The solid line is a computation of the average of the points that are observed.
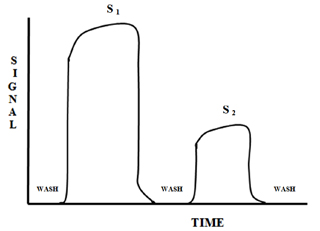
The plots in Figure 3 demonstrate the difficulty encountered when trying to measure at a point other than steady state when using a batch method.
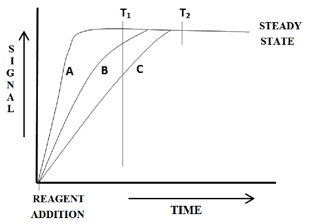
At time T1, three distinctively different values for the same sample are obtained. Only at time T2 are the values similar within experimental errors. Unfortunately, for the batch method only steady state signals can be used to obtain reproducible measurements.
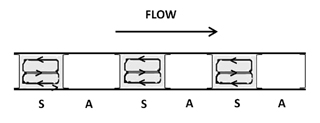
Eventually, the demand for a large number of analytical determinations per laboratory became apparent. The obvious answer was to automate the batch method approach. The basic concept was to reproduce the beakers of the batch method inside a flowing stream. The resulting technique was the air-segmented continuous flow analyzer. Figure 4 shows the classical single reagent manifold for air-segmented continuous flow analysis. Both R and S are fed by a peristaltic pump into the tubing where they eventually react. Once again, this rate of reaction is dependent on physical mixing and chemical kinetic rates.
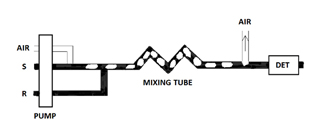
As the air-segmented continuous flow analyzer was originally designed it represented nothing more than automation of the batch method. This is true because proportional mixing is still involved. In a batch method proportional mixing is obtained when a known volume and concentration of R is poured into a known volume of S. In air-segmented continuous flow analyzers proportional mixing is obtained similarly when a constant flow of R is fed into a constant flow of S. In other words, R is merged with S at a specified, constant, and controlled ratio.
The air segments actually create the walls of the "beakers". As the "beakers" travel down the tubing, the solution drags against the walls of the tubing, thus creating the necessary mixing and convection (Figure 5). The important point about segmented continuous flow analyzers versus FIA is that the air bubbles are used to limit the amount of dispersion that can occur. Molecular diffusion is a minor component in the overall mixing process.
In practice the detector response of the air-segmented continuous flow analyzers produce signals such as those shown in Figure 6.
The actual air-segmented continuous flow analyzer peaks appear skewed. The origin of this phenomenon is carryover. Carryover occurs when R or S molecules remain on the walls of the tubing and pass on to the following segment. The liquid film that forms on the tubing walls makes the carryover process most influential on the physical equilibrium. Therefore, the rising portion of the output is a gradual increase to a "steady state" signal and the falling portion of the output is a gradual return to the established baseline.
For classical air-segmented continuous flow analyzers the only portion of the peak that the analyst can use for quantitation is the steady state plateau. The compressibility of the air bubbles affects mixing, i. e., the physical equilibrium, which in turn is the controlling factor on the rate of acquisition of the steady state signal.
The automation of chemical methods is necessary for cost, safety and reliability reasons and has been realized through the development of air-segmented continuous flow analyzers. Since careful control of the air bubbles is critical to the optimized performance of these systems, start up and stabilization require considerable time. Is there a better way to do automated continuous flow analysis? Yes!
The question that must be asked is, what Is needed to produce an automated system with high reproducibility? It has been shown in the previous sections that the answer is a system in which the physical mixing can be carried out reproducibly. Neither batch methods nor air-segmented continuous flow analyzers have reproducible physical mixing. The air bubbles in the air-segmented continuous flow analyzers are the major source of randomness in the system. They cause irreproducible mixing and therefore create the need for a "steady state" measurement.
What happens when the bubbles are removed from the system? The answer is Flow Injection Analysis (FIA)! As a consequence of the air bubbles being removed from the system, the physical mixing of the reagent and sample can be reproducibly performed.
As shown in Figure 7, in FIA the sample is injected into a nonreactive carrier stream, not introduced into the system through the pump. The sample plug is pushed down the tube to the tubing tee or junction. The reagent is pumped down another tube towards the same tee. The reagent is usually continuously pumped. The carrier stream containing the sample zone is merged with reagent at the tee.
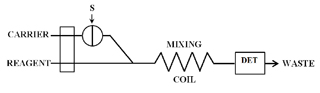
The exact mechanism of how R and S merge is important but the details are beyond the scope of this discussion. However, it is important to realize that the flow characteristics and mixing at this union are very reproducible.
The combined R and S pass through a coiled section of tubing in order to provide the necessary conditions for the desired chemistry. The coil dimensions, the sample volume injected and the flow rates of R and C are optimized for the given chemistry being utilized.
The FIA system itself provides the reproducible physical conditions, in contrast to batch methods or air-segmented continuous flow analyzers. This is true since the FIA system contains no components that create random turbulence. Only reproducible convection will be observed.
The next question is whether a steady state signal is a requirement for precise quantitation in an FIA system. Since identical physical and chemical conditions can consistently be obtained, as long as the system configuration is not changed, steady state is not a necessary requirement.
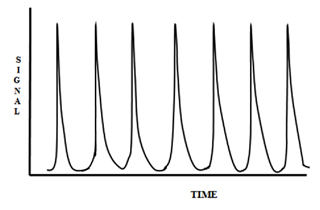
Figure 8 is a printout of multiple injections of a dye and is a typical example of the physical reproducibility of FIA.
The next questions are, does the addition of the chemistry to the system affect this reproducibility and is it necessary for a chemical reaction to reach completion before detection?
Figure 9 shows the development of an analytical signal with respect to time where the reaction is eventually complete (point B).
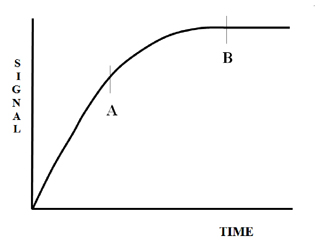
It is clear that point A could not be reproducibly measured in the batch and air-segmented continuous flow systems. However, the reproducible timing and the subsequent reproducible physical mixing make the measurement of point A using FIA highly precise. The addition of chemistry to the system does not appear to significantly alter any of these physical characteristics. Although the chemistry (kinetics) is also affected by temperature and pressure, these can be kept constant in the FIA system.
Flow Injection methods can be regarded as fixed-time kinetic methods since the signal is detected at conditions where neither physical equilibrium (homogenization of a portion of the flow) nor chemical equilibrium (reaction completeness) has been reached by the time. Operational timing must always be highly reproducible because measurements are carried out under non steady physical and chemical conditions, so small changes may seriously affect the results obtained.