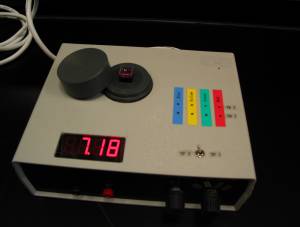
Figure 1. A prototype four LED-based photometer.
Chemical Education Journal (CEJ), Vol. 7, No. 2 /Registration No. 7-18/Received October 27, 2003.
Department of Chemistry, Hong Kong Baptist University, 224 Waterloo Road, Kowloon Tong, Hong Kong SAR, P. R. China
School of Chemical Engineering, Sichuan University, Chengdu 610065, P. R. China
* Corresponding should be addressed to M. M. F. Choi.
E-mail: mfchoi@hkbu.edu.hk
1) Presented at the Tenth Asian Chemical Congress, Hanoi, Vietnam on 21-24 October 2003.
Abstract
1. Introduction
2. Principle
3. Experimental
4. Results and Discussion
5. Conclusion
Acknowledgements
References
Abstract: In this article, a four-LED based photometer, in which four LEDs are used as light sources, are demonstrated to be an useful instrument for water and air pollutants analyses. This photometer is applicable to various spectrophotometric methods for the determination of chemical species exhibiting absorption maxima of the coloured complexes in the visible light spectrum. The target analytes are absorbed and reacted with colorimetric reagents in specially designed passive samplers and the absorbances of the resulting compounds are subsequently measured by the photometer. The concentrations of the analytes are calculated from calibration curves based on the Beer-Lambert law. Four experiments have been developed for the environmental analysis: (1) Analysis of airborne formaldehyde: This experiment makes use of a passive sampler to collect formaldehyde in indoor air. The sampler consists of two large surface gas-permeable diffusion membranes that regulate the permeation rate of the gas. After diffusion, the formaldehyde is analysed by a colorimetric method using 3-methyl-2-benzothiazolinone hydrazone hydrochloride and the red-LED based photometer. (2) Analysis of nitrogen dioxide: Nitrogen dioxide (NO2) in air is collected by an absorbent reagent in the passive sampler. When NO2 and absorbent reagent are brought together, a pink colour azo dye is developed. The absorbance of the dye is directly proportional to the concentration of NO2 which is subsequently analysed by the green-LED based photometer. (3) Determination of copper in water sample: This experiment describes the formation of a blue complex between Cu(II) ions and oxalic acid bis(cyclohexylidene hydrazide) and the concentration of Cu(II) is then determined by the yellow-LED based photometer. (4) Determination of iron content in commercial minerals tablet: In this experiment, Fe(III) in a commercial iron tablet is extracted with nitric acid. The digested sample then reacts with potassium thiocyanate to form a blood red complex solution. A blue-LED based photometer is employed to determine the iron content in the tablet. The proposed four LED-based photometer possesses the advantages of low cost, durability, and long-term optical stability.
1. Introduction
The growing emphasis on environmental monitoring and analysis
has encouraged the development of more rapid and less expensive
methods for toxic pollutants. Light emitting diodes (LEDs) with
various emission wavelengths can provide many applications in
digital readout devices as they are inexpensive and easy-to-use
light sources in the visible light region [1]. LEDs have characteristic
wavelength emission maxima and bandwidths in the visible light
region. Since these cheap colour LEDs are easily available on
the market, it will be very straightforward to employ them as
the irradiation sources for different photometric measurements.
As such, a photometer operating with different colour LEDs can
possibly be a cheap and versatile device for the analysis of many
different kinds of samples. The main objective of this article
is to demonstrate the application of a four-LED based photometer
for environmental analysis. The development of a LED-based photometer
possesses the advantages of low cost, durability, and long-term
optical stability.
In this article, in conjunction with a home-made passive sampler
we report the use of a four LED-based photometer to determine
airborne formaldehye (HCHO), nitrogen dioxide (NO2), copper in water sample and
iron content in minerals tablet. Since these analytes can be determined
by some well-established colorimetric methods [2-6], they are
chosen to demonstrate the capability of our developed four LED-based
photometer.
2. Principle
Colorimetric and spectrophotometric methods are perhaps the
most frequently used and important methods of quantitative analysis.
These methods are based on the absorption of light by a sample.
The amount of radiant energy absorbed is proportional to the concentration
of the absorbing material, and by measuring the absorption of
radiant energy, it is possible to determine quantitatively the
amount of substance present. In this work a prototype four LED-based
photometer shown in Figure 1 was employed to determine some environmental
pollutants including HCHO, NO2, Cu(II)
and Fe(III).
Figure 1. A prototype four LED-based photometer.
These analytes can react with specific types of reagents to form some colour compounds which can be monitored and determined by the photometric methods. In each experiment, an individual LED is used as the radiation source. The radiation after passing through the absorbing analyte is allowed to fall on a photodiode which acts as the sensor and converts the light energy into an electrical signal which is proportional to the irradiation intensity. The electric signal can then be amplified, converted to voltage and shown in a liquid crystal display panel.
3. Experimental
3.1. Analysis of Airborne Formaldehyde
3.1.1. Introduction
Formaldehyde, a colourless and pungent-smelling gas, can
cause watery eyes, burning sensations in the eyes and throat,
nausea, and difficulty in breathing in some humans exposed at
elevated levels (above 0.1 parts per million). High concentrations
may trigger attacks in people with asthma. Formaldehyde is an
important chemical used widely by industry to manufacture building
materials and numerous household products. It is also a by-product
of combustion and certain other natural processes. Thus, it may
be present in substantial concentrations both indoors and outdoors.
Sources of HCHO in the home include building materials, smoking,
household products, and the use of un-vented, fuel-burning appliances,
like gas stoves or kerosene space heaters. Formaldehyde, by itself
or in combination with other chemicals, serves a number of purposes
in manufactured products. For example, it is used to add permanent-press
qualities to clothing and draperies, as a component of glues and
adhesives, and as a preservative in some paints and coating
products.
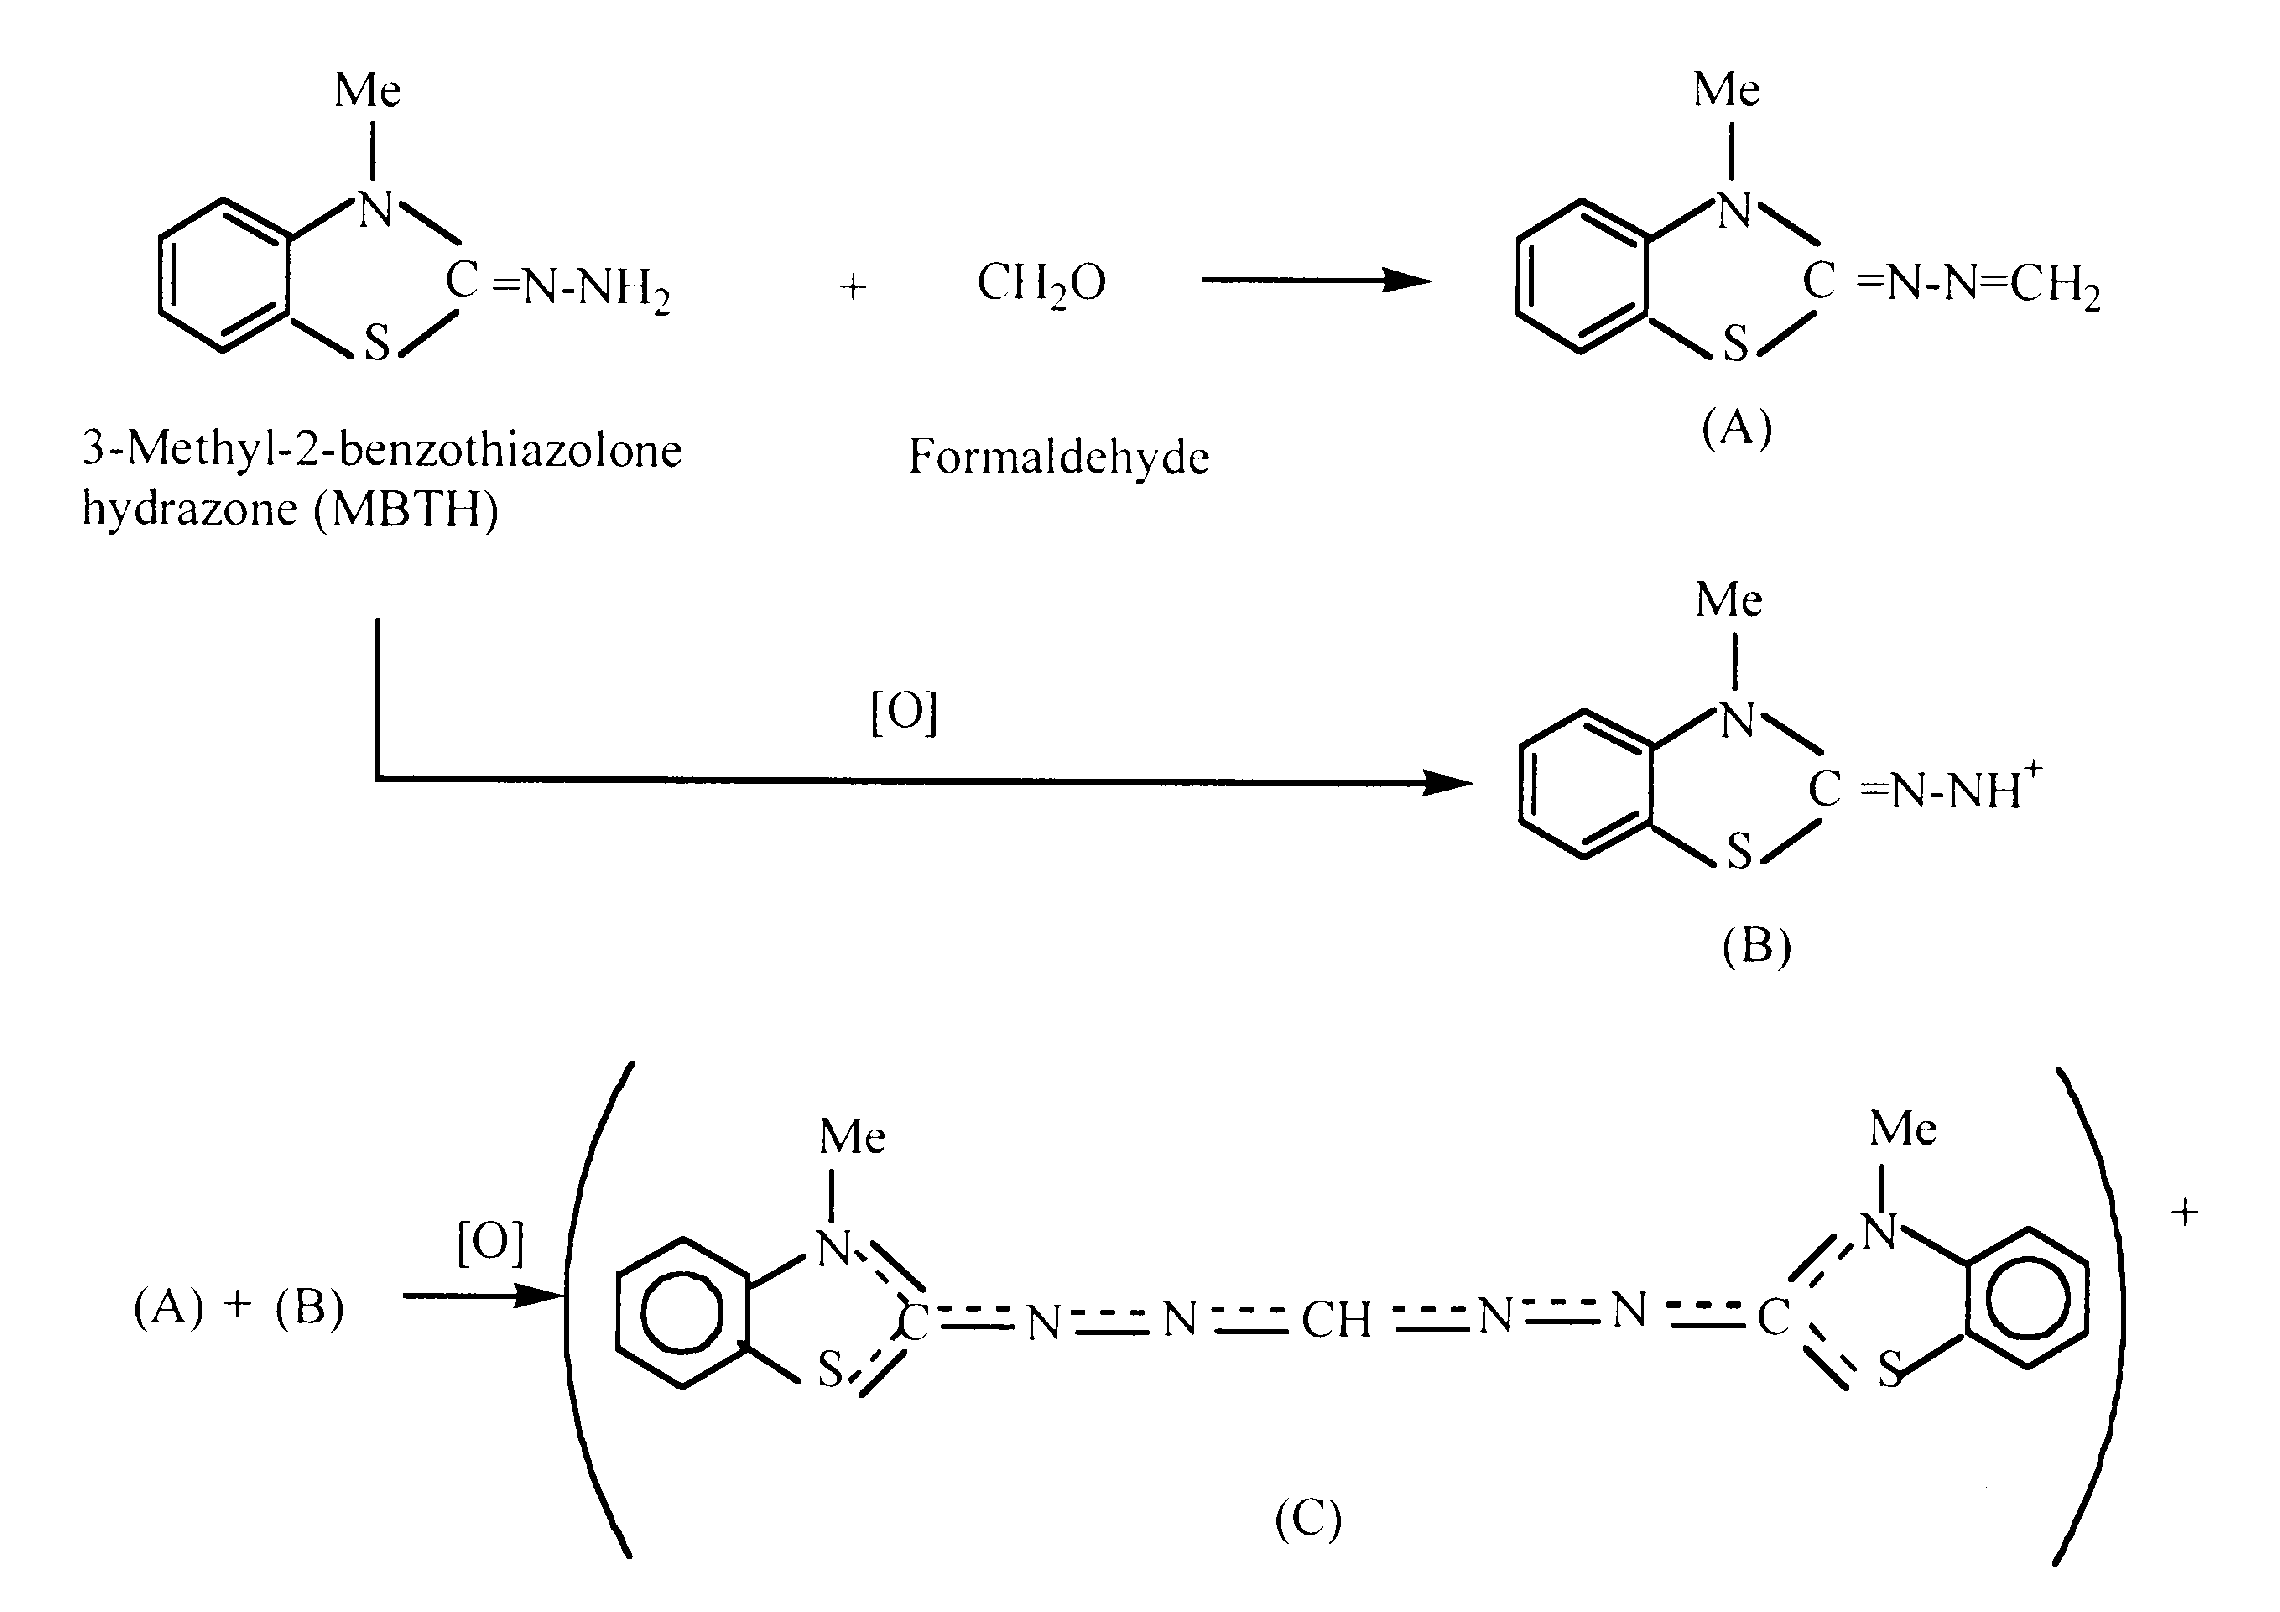
This experiment made use of a passive sampler to collect HCHO
in indoor air by the principles of diffusion. The sampler consists
of two gas-permeable diffusion membranes that regulate the transfer
gas. After diffusion, the HCHO is analysed by a colorimetric method
using 3-methyl-2-benzothiazolinone hydrazone hydrochloride (MBTH)
(Figure 2).
 (Click
for Original Figure)
(Click
for Original Figure)
Figure 2. Reactions
of HCHO and MBTH.
This test method covers personal or area measurements of HCHO
in indoor air in the range from 0.01 to 0.17 mg/m3
(0.008 to 0.14 ppm v/v). The recommended sampling time is 15 to
30 min. The lower quantification limit is 0.03 ug of formaldehyde
per millilitre of absorbent solution. A formaldehyde concentration
of 0.01 mg/m3 (0.008 ppm v/v) can be determined in
indoor based on using an aliquot of 5 mL absorbent solution in
a period of 30 min.
When HCHO and MBTH are brought together and further oxidised by
oxidising reagent, a green coloured develops (Figure 3). The concentration
can be determined by colorimetry. The absorbance is directly proportional
to the concentration of the coloured constituent.
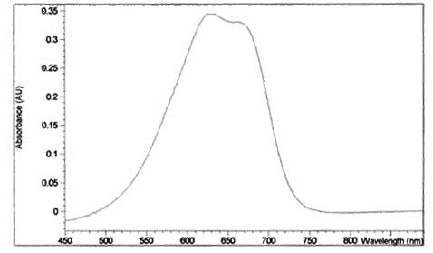 Figure 3. Visible absorption
spectrum of cationic dye, C.
Figure 3. Visible absorption
spectrum of cationic dye, C.
3.1.2. Procedure
3.1.2.1. Preparation of HCHO standards
(a) Prepare a HCHO-absorbing solution by dissolving about
0.025 g of MBTH in 50 mL deionised (D.I.) water (0.05 % MBTH).
(b) Prepare an oxidising reagent by dissolving about 0.16 g of
sulphamic acid and 0.1g of ferric chloride hexahydrate in 10 mL
D.I. water.
(c) Prepare a calibration curve of HCHO according to the following
table:
|
|
|
|
|
|
|
|
|
|
|
|
|
|
|
|
|
|
(d) After dilution, let standards stand for 1 hour and finally
add 1 mL of oxidising reagent. After 15 min, measure the reading
using the red LED-based photometer. Calculate the absorbance for
each standard based on the following equation:
![]() (1)
(1)
where A: absorbance, Eo: reading for reagent blank; E: reading for standard or sample solution.
3.1.2.2. Sampling of airborne HCHO
(a) Measure the volume of the passive sampler (Figure 4).
(b) Wash the sampler with distilled water. Rinse and fill up with
the 0.05 % MBTH solution.
(c) After 30-minutes sampling, empty the solution into a 20 mL
vial. Add 1 mL of oxidising reagent and wait for 15 min.
(d) Measure the reading using the red LED-based photometer. Calculate
the absorbance for the sample using equation (1).
(e) Plot a calibration curve and determine the HCHO in the sample
solution.
3.2. Analysis of Airborne Nitrogen Dioxide
3.2.1. Introduction
Nitrogen dioxide is a precursor in photochemical smog
formation. In the presence of sunlight, NO2
dissociates to form highly reactive atomic oxygen. The atomic
oxygen released further initiates reactions with hydrocarbons,
nitrogen oxides (usually in the presence of light) to form compounds
such as ozone and other oxidants such as aldehydes, peroxyacetylnitrate
(PAN). Aldehydes are toxic and can condense to form aerosols which
limits visibility. Ozone and PAN are extremely toxic to plants
and can cause oxidative damage to many materials such as fabrics,
plastics and rubber. They are also very powerful lachrymators
or eye irritants.
Nitrogen dioxide in air is collected by a passive sampler as shown
in Figure 4. These passive samplers are made of Teflon which hold
fixed volumes of liquid absorbents. They allow natural diffusion
of gas into the liquid. They allow to monitor simultaneously a
large number of sampling sites. The sampling rate can be determined
experimentally and it is normally provided by the supplier.
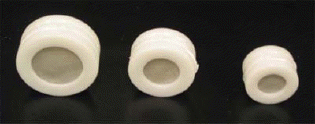
Figure 4. Passive samplers with different dimensions.
When NO2 and the absorbent reagent are brought together, a pink coloured solution is developed. The colour is due to the establishment of an azo dye complex as displayed in Figure 5. The visible absorption spectrum of the azo dye is shown in Figure 6. Since the complex is the only coloured species in the system, the concentration of NO2 can be determined by colorimetry. The absorbance is directly proportional to the concentration of the coloured constituent.
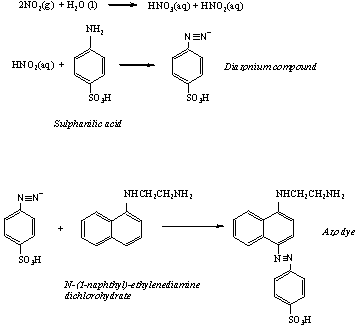
Figure 5. Reactions of NO2 and absorbent
reagents.
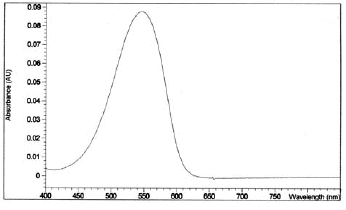
Figure 6. Visible absorption spectrum of the azo dye.
3.2.2. Procedure
3.2.2.1. Preparation of reagent and standards
(a) Absorbent reagent
10 g of sulphanilic acid and 0.1 g of N-(1-naphthyl)-ethylenediamine
dichlorohydrate are dissolved in 20 mL of 1-propanol, and make
up to 2 litres with deionised water.
(b) Preparation of 10 ppm stock standard solution
5 mL of 1000 ug/mL NO2
solution is diluted to 500 mL volumetric flask with deionised
water.
(c) Prepare a series of standard solutions
Transfer 0.05, 0.1, 0.2, 0.3, 0.4 mL of this stock 10 ug/mL
NO2 solution to a series of 25 mL volumetric
flasks and make up to the marks with the absorbent reagent.
(d) Let the colour develops for 15 min and then measure the reading
using the green LED-based photometer. Calculate the absorbance
for each standard using equation (1).
3.2.2.2. Sampling of NO2
(a) Measure the volume of the passive sampler (Figure
4).
(b) Wash the sampler with distilled water. Rinse and fill up with
the absorbent reagent.
(c) After 30-minutes sampling, empty the solution into a 20 mL
vial. After sampling, let the colour develops for 15 min and then
measure the reading using the green LED-based photometer. Calculate
the absorbance for the sample using equation (1).
(d) Plot a calibration curve and determine the NO2
in the sample solution.
3.3. Analysis of Copper in Electroplating Solution
3.3.1. Introduction
Cu(II) can react with oxalic acid bis(cyclohexylidene
hydrazide) (cuprizone) (Figure 7) to form a blue complex with
a broad absorption band in the visible light region (Figure 8).
The absorbance of this complex is insensitive to pH changes and
is therefore commonly used for the determination of copper.
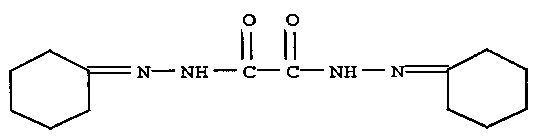
Figure 7. Chemical structure of cuprizone
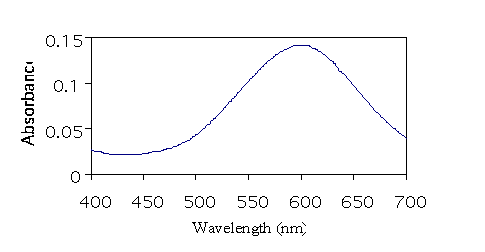
Figure 8. Visible absorption spectrum of Cu(II)-cuprizone
3.3.2. Procedure
3.3.2.1. Preparation of reagents and standards
(a) Dissolve 0.5 g cuprizone in 100 mL 50 % ethanol with heating.
The reagent solution is stable for about three months if stored
in a well-closed container in a cool place.
(b) To a 100 mL D.I. water dissolves 75 g citric acid. Add the
solution into 95 mL 25 % ammonia solution slowly with care, and
make up to 250 mL with the D.I. water.
(c) Prepare a series of Cu(II)-cuprizone standard solutions by
mixing different amounts of 100.0 ppm Cu(II) stock solution and
citrate buffer, then followed by adding 2.00 mL cuprizone reagent
according to the following table:
| Volume of Cu(II) stock solution (mL) | Volume of cuprizone (mL) | Volume of citrate buffer (mL) | Final conc. (ppm) | Final volume (mL) |
|
|
|
|
|
|
|
|
|
|
|
|
|
|
|
|
|
|
|
|
|
|
|
|
|
|
|
|
|
|
|
|
|
|
|
|
(d) Pipette 10.0 mL sample solution to a 50-mL volumetric flask
containing 2.00 mL cuprizone and 5.00 mL citrate buffer, dilute
to 50 mL with the citrate buffer.
(e) Measure the readings using the yellow LED-based photometer
and calculate the absorbance values of each standard and sample
solutions using equation (1).
(f) Plot a calibration curve and determine the Cu(II) in the sample
solution.
3.4. Analysis of Iron in Commercial Minerals Tablet
3.4.1. Introduction
Fe(III) in a commercial minerals tablet is digested and
extracted with nitric acid. The analyte then reacts with potassium
thiocyanate to form a blood red complex solution with visible
absorption spectrum depicted in Figure 9.
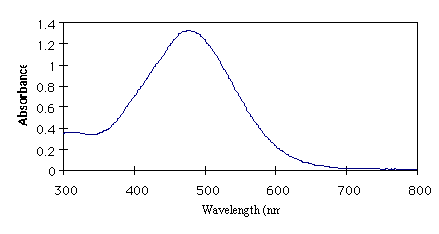
Figure 9. Visible absorption spectrum of Fe(III)-SCN complex.
3.4.2. Procedure
3.4.2.1. Preparation of reagents and standards
(a) Preparation of stock KSCN Solution
Dissolve 5 g potassium thiocyanate (KSCN) in D.I. water and make
up to 50 mL with D.I. water.
(b) Preparation of 100 ppm Fe(III) standard solution
Dissolve 0.0723g of Fe(NO3)3·9H2O in D.I. water and make up to 100 mL with
D.I. water.
(c) Preparation of a series of standard solutions
Transfer 50, 150, 250, 350, 500 uL of 100 ppm standard solutions to a series
of 50 mL volumetric flasks to prepare 0.1, 0.3, 0.5, 0.7, 1.0
ppm standard solutions. Add 1 mL stock KSCN solution and make
up the standards to the marks with 0.1 M nitric acid. Prepare
a blank solution by adding 1 mL stock KSCN solution to a 50 mL
volumetric flask and dilute to the mark with 0.1 M nitric acid.
3.4.2.2. Preparation and analysis of tablet sample
(a) Weigh one commercial minerals tablet and crush the tablet
with a mortar and pestle. Weigh 0.1 g of sample in an analytical
balance and digest it in 5 mL conc. nitric acid in a fumehood.
(b) After digestion, dilute to 30 mL with D.I. water and remove
the insoluble material by filtering the solution into a 100 mL
volumetric flask. Bring the solution to the mark with D.I. water.
(c) Add 250 uL of the sample solution and 1 mL stock KSCN to 50
mL volumetric flask and dilute to the mark with 0.1 M nitric acid.
(d) Measure the readings using the blue LED-based photometer and
calculate the absorbance values of each standard and sample solutions
using equation (1).
(e) Plot a calibration curve and determine the Fe(III) in the
sample solution.
4. Results and Discussion
4.1. Analysis of Airborne Formaldehyde
The calibration plot of HCHO is shown in Figure 10 and it
follows the Beer's law quite well.
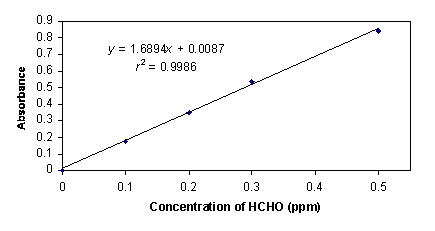
Figure 10. Calibration plot for HCHO.
Three air samples were determined based on the calibration curve and the results are displayed in Table 1.
Table 1 Analysis of airborne HCHO
|
|
|
|
|
|
|
|
|
|
|
|
In 2002, the annual average of airborne HCHO in Hong Kong was 4-6 ug/m3 [7]. Our results have about three or four times of this level. It is possible that our air samples were collected in an indoor environment which normally has higher concentration of HCHO due to its emission from building materials, smoking, and household products, etc. In brief, our proposed method demonstrates a simple, fast and convenient procedure to determine airborne formaldehyde in indoor or outdoor environment.
4.2. Analysis of Airborne Nitrogen Dioxide
The calibration plot of NO2 is displayed
in Figure 11 and it has very good linearity ranging from 0 to
0.16 ppm.
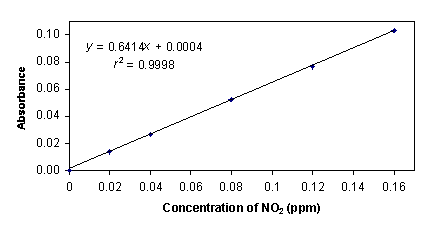
Figure 11. Calibration plot for NO2.
Three air samples were determined using the calibration curve and the results are shown in Table 2.
Table 2 Analysis of NO2
|
|
|
|
|
|
|
|
|
|
|
|
This method demonstrates a simple and convenient procedure to determine nitrogen dioxide with good precision and accuracy. The total sampling time was only 15-30 min.
4.3. Analysis of Copper in Electroplating Solution
In Figure 12 the experimental results are plotted as absorbance
versus Cu(II) concentration. A linear straight is obtained in
the tested range 0-2 ppm, showing that the method can be applied
to determine copper in electroplating solution. A sample solution
determined by the photometer was found to be 0.92 ppm which was
close to the result (0.95 ppm) obtained by a spectrophotometric
method. This demonstrates that the proposed method can be successfully
applied to determine copper in water samples.
The Beer's law is followed quite well, in spite of the fact that
deviations are expected when the radiation used is not monochromatic
[8].
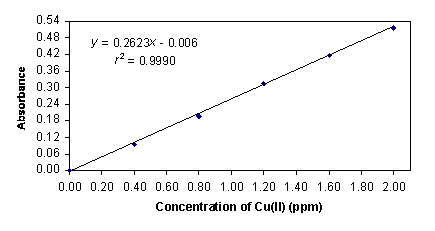 Figure 12. Calibration plot
for Cu(II)-cuprizone complex.
Figure 12. Calibration plot
for Cu(II)-cuprizone complex.
4.4. Analysis of Iron in Commercial Minerals Tablet
Commercial minerals tablets were purchased from a local store
to determine their iron contents using our proposed method. Each
tablet was digested and extracted to nitric acid with subsequent
reaction with KSCN to form a red complex solution. A standard
calibration curve (Figure 13) was constructed covering the range
0-1.00 ppm based on the blue LED-based photometer. The concentration
of the digested sample solution was then determined by the calibration
curve. It was found that each minerals tablet contained about
56 mg which was close to the claimed value (50 mg) of the manufacturer.
As such, the proposed method can be successfully applied to determine
the iron content in minerals tablets.
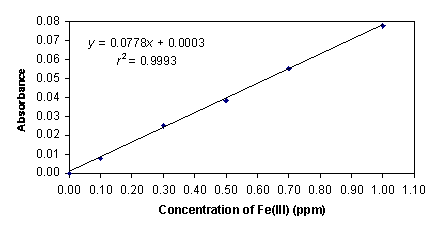
Figure 13. Calibration plot for Fe(III)-SCN complex.
5. Conclusion
Our developed four LED-based photometer is a very versatile
instrument which is suitable for most photometric measurements.
The analytical working wavelengths range from 450 to 640 nm and
covers almost the whole visible light region. It does not require
any monochromator or colour filter to do the wavelength selection.
Instead, the working wavelengths are chosen by just employing
a blue, green, yellow or red LED as the light source. These LEDs
can provide high luminous for photometric measurement. In fact,
the relative sensitivity of the photometer with respect to that
of commercially available spectrophotometers varies with the degree
of overlapping between the emission spectrum of LED and absorption
spectrum of the coloured compound [9]. The manufacturing of the
photometer is easy as the electronic components are readily available
on the market and the total cost is about 100 US dollars. It can
be used not only for environmental analysis but also for educational
purposes, especially in high schools, where expensive spectrophotometers
are not available.
Acknowledgements
The authors gratefully acknowledge the technician team of
the Department of Chemistry, HKBU for their technical support.
Special thanks are also given to Miss Ruth W. Y. Chu and Ms. April
K. Y. Lau for their dedicated work.
References
[1] Lisensky, G. C.; Penn, R.; Geselbracht, M. J.; Ellis,
A. B. J. Chem. Educ. 1992, 69, 151-157.
[2] Fries, J.; Getrost, H. Organic Reagents for Trace Analysis; E. Merck: Darmstadt, Germany, 1977; pp 127-129.
[3] Mozo, J. D.; Gal , M.; Rold , E. J. Chem. Educ. 2001, 78, 355-357.
[4] Sawicki, E.; Hauser, T. R.; Stanley, T. W.; Elbert, W. Anal. Chem. 1961, 33, 93-96.
[5] Keith, L. H.; Walker, M. Handbook of Air Toxics: Sampling, Analysis, and Properties, CRC Press: Boca Raton, FL, 1995.
[6] Sandekk, E. B. Photometric Determination of Traces of Metals, 4th ed.; Wiley: New York, 1989.
[7] Air Quality in Hong Kong 2002, Air Services Group, Environmental Protection Department, The Government of the Hong Kong Special Administration Region, 2002.
[8] Skoog, D. A.; Holler, F. J.; Nieman, T. A. Principles of Instrumental Analysis, 5th ed.; Harcourt Brace: Orlando, FL, 1998, 305-306.
[9] Fujinaga, K.; Hashitani, H.; Okumura, M.; Furukawa, A. Int. J. Environ. Anal. Chem. 1992, 47, 251-256.
 Top
Top
 CEJ Vol. 7, No. 2, Contents