Chemical Education Journal (CEJ), Vol. 18 / Registration No.
18-101 / Received October 13, 2015.
URL = http://www.edu.utsunomiya-u.ac.jp/chem/cejrnlE.html
A Simple Case Study for the Introduction of the HMBC
and the EI-MS Techniques to Second and Third Year Undergraduate
Students.
Esther H. S. WOO1, Mackenzie J. FIELD1,
Mathew L. SUTHERLAND1, Chloe A. N. GERAK2*
and Nabyl MERBOUH1*
1Simon Fraser University, Department of Chemistry,
8888 University Drive, Burnaby, BC, V5A 1S6, Canada.
E-mail: nmerbouh sfu.ca
2University of British Columbia, Department of Biochemistry
and Molecular Biology, 2350 Health Sciences Mall, Vancouver, BC,
V6T 1Z3, Canada.
E-mail: cagerakalumni.ubc.ca
Abstract
The structure elucidation and spectral assignments of two constitutional
isomers of phenylbutyric acid proved to be more challenging
than anticipated for second year undergraduate students. When
given 3-phenylbutyric acid and α-methylhydrocinnamic acid
as unknowns, definitive identification by usual spectroscopic
methods required more careful analyses of the spectroscopic data,
along with the use of additional analytical techniques. By solely
relying on the usual 1D-NMR spectroscopy (1H-NMR, 13C-NMR),
or even 2D-NMR spectroscopy (COSY, HSQC), students' structures
could only be partially solved. Additional spectroscopic methods
such as HMBC and mass spectrometry (EI-MS) were needed for the
complete spectral assignments, thus making these "simple"
compounds ideal case studies for the introduction of HMBC, EI-MS
and basic computational chemistry at the undergraduate level.
Keywords
Nuclear Magnetic Resonance (NMR) Spectroscopy, Mass Spectrometry
(MS), Computational Chemistry, Structure Elucidation.
Contents
Introduction
In first and second year organic chemistry classes, students
are often exposed to a series of analytical methods to learn about
the identification of synthesized compounds. In general, students
start by recording melting points (mp) and infrared (IR) spectra
of their compounds and are given the 1H-NMR spectrum
to complete their identification. Occasionally, the chemical formula,
chemical ionization mass spectrum (CI-MS) or elemental analysis
is provided to the student as a resource to facilitate their assignments.
We, as instructors, have all witnessed that, as soon as students
are introduced to 1H-NMR spectroscopy and become acquainted
with the spectrometer use, it rapidly becomes the sole analytical
method, often at the expense of all other methods. One may be
led to think that 1H-NMR spectroscopy has no limitation
in distinguishing compounds and that it is a universal analytical
method that can solve it all.
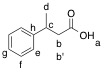
In this paper, we will introduce a very simple identification
exercise based on the spectral comparison of two isomers of phenylbutyric
acid (phenylbutanoic acid): 3-phenylbutyric acid (PBA) and α-methylhydrocinnamic
acid (MHCA) (2-methyl-3-phenylpropanoic acid) (Figure
1). The students are asked for the unequivocal differentiation
and spectral assignment of the structure of these compounds based
on the knowledge and analytical data that is typically studied
in their first few years of organic chemistry.
The questions that we are asking the students are the following:
i) Can you unequivocally assign each spectrum to each compound
and can you explain your assignment rationale? ii) Do you understand
the strengths and limitations of each of the analytical techniques
you used? iii) Did you need to learn other analytical techniques,
and how did they help?

Figure 1. Chemical structure of α-methylhydrocinnamic
acid (MHCA) and 3-phenylbutyric acid (PBA).
Methods
3-Phenylbutyric acid and α-methylhydrocinnamic acid were
purchased from Sigma-Aldrich and used without purification.
Melting points were recorded using a Barnstead Mel-Temp capillary
melting point apparatus and are uncorrected. 1H-NMR
and 13C-NMR were recorded on a Bruker 400 or 500 MHz
spectrometers and were referenced to residual solvent peaks (CDCl3, 7.26 ppm for 1H-NMR, and 77.1
ppm for 13C-NMR). The mass spectra were recorded on
a Varian 4000 GC/MS/MS spectrometer. IR spectra were recorded
on a PerkinElmer UATR Two Fourier transform spectrophotometer
and the UV spectra were recorded on a Varian Cary 100 Bio spectrophotometer.
Results
3-Phenylbutyric acid (PBA): C10H12O2, white solid,
mp = 36-38 °C. 1H-NMR (400 MHz, CDCl3) δ = 10.17 (Very broad signal, no reliable
integration possible); 7.31 (m, 2H); 7.22 (m, 3H); 3.28 (sextet
resembling signal, 1H); 2.68 (dd, J = 15.5, 6.8 Hz, 1H);
2.58 (dd, J = 15.5, 8.2 Hz, 1H) 1.33 (d, J = 7.0
Hz, 3H) ppm. 13C-NMR (101 MHz, CDCl3)
δ = 178.11, 145.50, 128.65, 126.79, 126.60, 42.55, 36.24,
21.94 ppm. IR (ATR, neat) ν = 3091-2569 (broad band), 1698,
1430, 1279, 1215, 927, 755, 691 cm-1. UV (DCM) λmax (ε) = 258 nm (187 M-1
cm-1). EI-MS m/z = 164 (Molecular Ion), 118,
105 (Base Peak), 79, 77.
α-Methylhydrocinnamic acid (MHCA):
C10H12O2, white solid, mp = 38-40 °C.
1H-NMR (400 MHz, CDCl3)
δ = 11.14 (Very broad signal, no reliable integration possible);
7.30 (m, 2H); 7.20 (m, 3H); 3.08 (dd, J = 13.3, 6.3 Hz,
1H); 2.77 (sextet resembling signal, 1H); 2.68 (dd, J =
13.4, 8.0 Hz, 1H) 1.18 (d, J = 6.9 Hz, 3H) ppm. 13C-NMR
(101 MHz, CDCl3) δ = 182.00, 139.10,
129.09, 128.51, 126.52, 41.24, 39.39, 16.59 ppm. IR (ATR, neat)
ν = 3086-2557 (broad band), 1698, 1453, 1209, 1249, 1230, 941,
740, 702 cm-1. UV (DCM) λmax
(ε) = 258 (145 M-1 cm-1).
EI-MS m/z = 164 (Molecular Ion), 118, 91 (Base Peak),
77, 65.
Discussion
We are exposing the second year students to 1H-NMR
spectra of both 3-phenylbutyric acid and α-methylhydrocinnamic
acid with a simple task, to assign all the peaks in the 1H-NMR
spectra and determine which spectrum corresponds to which compound.
This proved to be a challenging exercise for the students on many
levels. Looking at the proton spectra (Figure
2) and the structures, the presence of diastereotopic protons
[1] (see Appendix)
may be the first difficulty encountered in the assignment for
the students. Secondly, the chemical shifts and peak shapes of
all the protons in the spectra are nearly identical and appear
in the same relative spectral region, making the differentiation
between the two compounds almost impossible. The simplicity of
the 1H-NMR spectra with their limited information and
limited amount of signals thus demonstrated the need for additional
analytical data.
Students are given each compound in an unlabelled vial and,
under an instructor's supervision, are asked to differentiate
these two compounds. They will be provided access to any needed
spectroscopy technique, external literature and all available
software in a chemistry department. This allows the students to
embark on a series of measurements, starting with simple experiments
such as elemental analysis and melting points. [For the sake
of this article and for clarity, we will assign all the spectra
to the respective compounds; a set of spectra and their Free Induction
Decays (FIDs) will be provided in the supplementary material for
instructors and training purposes.]
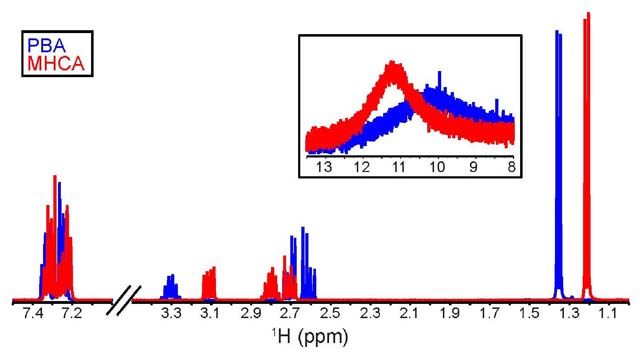
Figure 2. Superimposed 1H-NMR spectra of
PBA (blue) and MHCA (red) in CDCl3, showing
relevant regions.
Differentiation using elemental analysis. As the compounds
are constitutional isomers (see Appendix),
the students should quickly abandon the elemental analysis technique
since it will give identical results in both cases. While it is
a valuable technique in many cases, it is not helpful in this
instance since it only provides the partial chemical composition
of the two compounds.
Differentiation using melting point. Simply taking the
melting point of these compounds will indicate that the students
are dealing with two different compounds as there are two different
melting point ranges: 36-38 °C and 38-40 °C. The melting
points of the two isomers are similar and almost overlapping.
Therefore, the students would have to be certain that the melting
points are taken accurately on a well-calibrated apparatus and
that no impurities are present in their samples. The subsequent
question to be asked to the student is: can you base your entire
identification on melting points that are in such close proximity
to each other? The student should conclude that they cannot accurately
distinguish between the two compounds and can then move on to
other types of spectroscopy, such as IR and UV spectroscopy. Both
of these techniques are quick and allow for the immediate recording
of spectra while requiring limited data processing.
Differentiation using IR spectroscopy. The stacked IR
spectra of both compounds (Figure 3)
show limited differences between the compounds. The near-identical
functional group identification (carbonyl groups visible at
1698 and 1699 cm-1, hydroxyl groups of carboxylic acids
between 3050 and 2400 cm-1, aromatic (C=C) stretches
between 1600 and 1450 cm-1) and the fingerprint
region offer very little help to differentiate between the compounds.
Because the compounds have identical "building blocks",
IR spectroscopy is not a suitable technique to differentiate between
these structural isomers. Nonetheless, it is extremely helpful
in providing the students with information on the functional groups
present in both molecules.
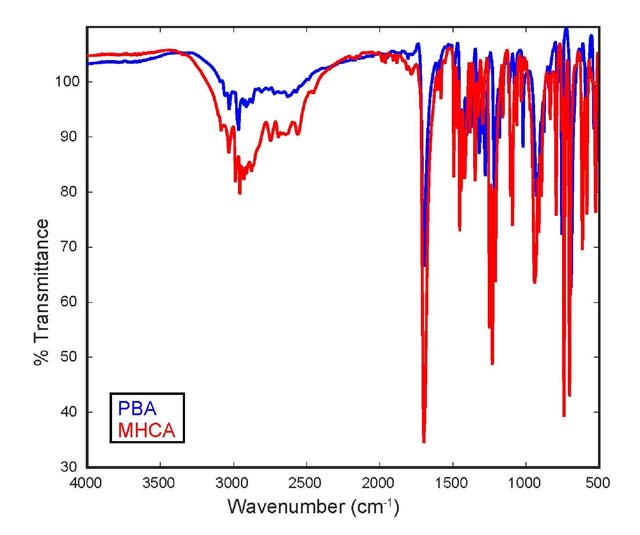
Figure 3. Stacked IR spectrum (ATR, neat) of
PBA (blue) and MHCA (red).
Differentiation using UV spectroscopy. UV spectroscopy
can be useful in certain cases when structural isomers have different
absorption maxima due to conjugation. However, overlaying the
UV spectra (Figure 4) show that both
compounds have identical absorption profiles and a λmax of 258 nm (benzene π → π* secondary
transition) with slightly different molar extinction coefficient
(ε) values. A quick literature search can provide the
students with the significance of the observed spectra, thus allowing
them to correlate the UV spectra to the possible structures [1].
For benzene, three aromatic π → π* electronic transitions
take place due to electron-electron repulsion and symmetry considerations.
These transitions correspond to the first primary band, the second
primary band and the secondary band. The first primary band occurs
at 184 nm and is a spin allowed transition but cannot be seen
in standard UV experiments. The second primary band typically
has a much larger molar absorptivity (ε = 7400) than those
observed in the MHCA and PBA spectra.
Comparatively, the benzene spectrum has the secondary band
displaying a molar absorptivity of 230 M-1 cm-1,
which is similar to the molar absorptivities we observe in the
MHCA and PBA spectra. The secondary band at 258 nm is the largest
peak observed in the UV spectra of both PBA (ε = 187 M-1
cm-1) and MHCA (ε = 146 M-1 cm-1).
This corresponds to an electronically allowed (π to π*)
and symmetry forbidden transition based on the symmetry of the
lowest energy anti-bonding molecular orbitals. Typically, most
of the intricate structure is seen in this secondary band, however
this is lost when using a polar solvent, such as DCM. This changes
the relative energies of distinct orbitals causing a loss of vibrational
fine structure and explains why shoulders are seen in the spectra
rather than distinct bands.
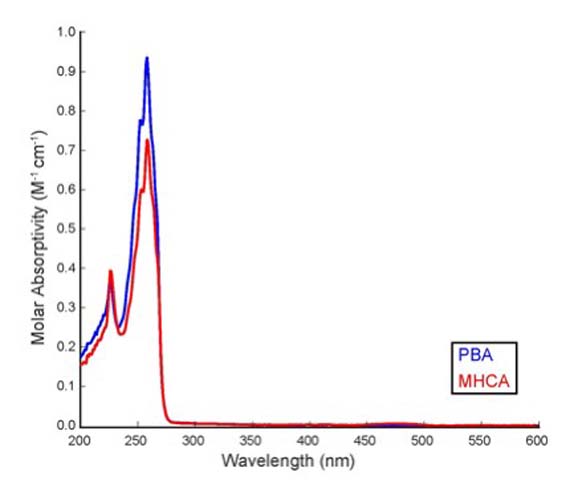
Figure 4. Superimposed UV spectra of PBA (blue) and
MHCA (red) in dichloromethane (0.05 M concentration, ambient temperature).
With the first analytical techniques giving almost identical
results, the students are now ready to turn to using NMR spectroscopy
as a method to solve their problem. As both compounds are soluble
in CDCl3, the students can easily prepare
their NMR samples and collect a NMR 'full package' to save time.
This package will consist of the following spectroscopy techniques:
1H-NMR, 13C-NMR, 13C-APT (attached
proton test) and DEPT (distortionless enhancement by polarization
transfer), COSY (correlation spectroscopy), HSQC (heteronuclear
single quantum correlation) and HMBC (heteronuclear multi-bond
correlation). However, with all these spectra on hand, students
should be warned that they might not need all of them to solve
the problem, that they might need to learn about more advanced
NMR techniques to interpret them properly and that there can never
be too much evidence to validate the structure of your final compound
[2-5].
Differentiation using 1D-NMR spectroscopy. At the second
year organic chemistry level, students are generally taught to
look at the following features in each NMR spectrum: the shape
of the peaks, their relative ratio of integrations and their chemical
shifts. It is only when more advanced NMR techniques and more
complex compounds are introduced that the students are made aware
of the importance of the coupling constants. In this exercise,
both compounds have identical multiplets with integrations of
2H and 3H in the aromatic region (7.31-7.20 ppm) consistent with
the presence of monosubstituted benzene rings, and 3H doublets
with similar chemical shifts and coupling constants (1.33 ppm,
J = 7 Hz for PBA and 1.18 ppm, J = 6.9 Hz for MHCA)
consistent with the presence of a shielded methyl group (-CH3). The region between 2.50 and 3.50 ppm, corresponding
to benzylic protons or protons adjacent to carbonyl groups, contains
the remainder of the peaks in the spectrum and includes a sextet-looking
signal and a pair of doublets of doublets (dd) for both compounds
(Figure 5).
Interestingly, this region shows several unexpected features
for such simple molecules. Upon closer examination of both spectra,
the sextet resembling signal was determined to be a multiplet
resulting from the presence within this signal of two different
coupling constants, which gave evidence to the presence of diastereotopic
protons in both molecules.
The diastereotopic protons (dd) have different chemical shifts
but almost identical coupling constants while exhibiting a very
strong "roof effect" [1]
(see Appendix), a phenomenon that
is a common second order effect [1]
(see Appendix), usually only
observed in low-field spectra.
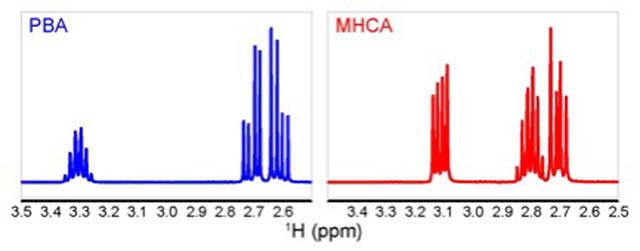
Figure 5. Side by side, truncated 1H-NMR
region (3.50 to 2.50 pm) for PBA (blue) and MHCA (red).
The information gathered by the 1H-NMR in this case
is substantial, as the students can now put together most of the
building blocks of their compounds: a carboxylic acid (-COOH,
confirmed by IR and 1H-NMR), a monosubstituted benzene
ring (-C6H5, confirmed
by 1H-NMR), a methyl group (-CH3,
confirmed by 1H-NMR) connected to a methine group (>CH-)
and possibly a methylene group (-CH2-)
carrying two diastereotopic protons, the lattermost still requiring
corroboration by complementary NMR techniques.
Students can also gather additional information from the 1H-NMR
including the chemical shifts of each peak and the coupling constants
that are found to be associated within each peak. At the second
year level, students may differentiate between unambiguous compounds
using the "predict the 1H-NMR shift" function
on ChemDraw®. They may also calculate or predict coupling
constants of the minimized structures using the Karplus equation
on the MestReJ software, or its modified versions, such as those
developed by Altona et al. [6-8].
The ChemDraw® prediction is generally a good indicator
of the relative chemical shifts of all protons in the molecule
and the program's coupling constant predictions provide a good
basis of the coupling trends.
ChemDraw 1H-NMR Predictions. As seen in Table 1, the stark differences between
the predicted and the observed chemical shifts are only seen for
one of the diastereotopic protons, where a difference of ±0.15
and ±0.20 ppm is observed for MHCA and PBA, respectively.
However, such predictions should only be used to provide students
with an idea of the chemical shifts differences of the protons
within the same molecule, and should not be used as evidence to
differentiate between the two molecules due to the large predictions
differences.
Table 1. Summary of the predicted (ChemBioDraw®,
Level: Ultra, Version 13.0.2.3020) and observed chemical shifts
for PBA and MHCA.
| |
Predicted |
Observed |
Difference |
| PBA |
δ CH3: 1.25 ppm
δ CH2: 2.62 & 2.38 ppm
δ CH: 3.20 ppm |
δ CH3: 1.33 ppm
δ CH2: 2.68 & 2.58 ppm
δ CH: 3.28 ppm |
±0.08 ppm
±0.06 & ±0.20 ppm
±0.08 ppm |
| MHCA |
δ CH3: 1.12 ppm
δ CH2: 3.08 & 2.83 ppm
δ CH: 2.85 ppm |
δ CH3: 1.18 ppm
δ CH2: 3.08 & 2.68 ppm
δ CH: 2.77 pm |
±0.06 ppm
±0.00 & 0.15 ppm
±0.08 ppm |
Structure Minimization and Coupling Constant Predictions.
PBA and MHCA molecules were built on GaussView (5.0) and optimized
with tight convergence along various parameters. The ground state
Hartree-Fock method, using the 6-311G basis set, was deemed most
appropriate for the undergraduate level; the optimization time
averaged approximately 1 hour and gave consistent results (Figure 6). (Note: after optimizing structures,
it was found that the enantiomers of both structures provided
different values for the dihedral angles. All values reported
are averages obtained from the enantiomeric structures). The
dihedral angles (Φ), as well as the angles between the diastereotopic
protons, were obtained from the minimized structures. The values
for the dihedral angles were then inputted into the MestReJ software
and the corresponding 3J coupling constants
were obtained. This procedure was repeated multiple times on several
computers for both molecules, with the average angles and coupling
constants summarized in Table 2.
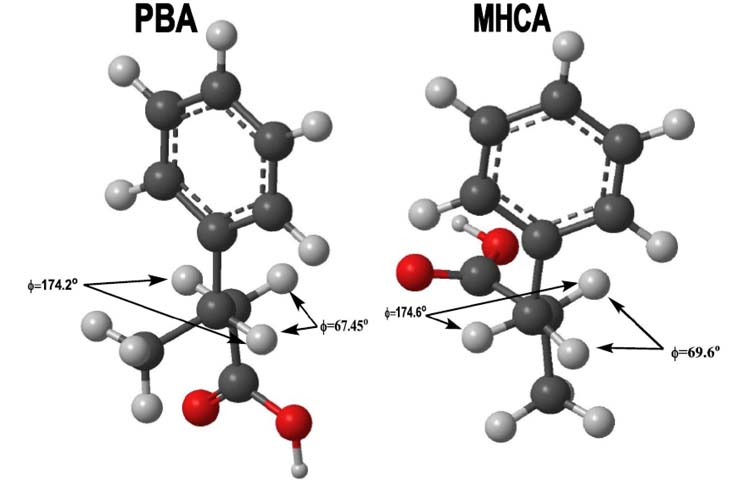
Figure 6. Minimized Structures for PBA and MHCA showing
the relevant dihedral angles [9a].
Table 2. Summary of the predicted (MestReJ) and observed
dihedral angle and coupling constants for PBA and MHCA in CDCl3. (HLA: Haasnoot-de Leeuw-Altona; DAD: Díez-Altona-Donders)
[6-10].
| |
 J and Φ values for MHCA
|
 J and Φ values for PBA
|
|
Karplus Prediction (Hz) |
3Jbc
= 1.699 Hz (69.6°)
3Jac = 10.14 Hz (174.6°)
2Jab = Not Predicted
(107.1°) |
3Jab
= 2.17 Hz (67.45°)
3Jac = 10.13 Hz (174.2°)
2Jbc = Not Predicted
(107.1°) |
|
Altona Prediction (Hz)
(HLA-General)
|
3Jbc =
1.46 Hz (69.6°)
3Jac = 14.47 Hz (174.6°)
2Jab= Not Predicted
(107.1°) |
3Jab
= 1.81 Hz (67.45°)
3Jac = 14.45 Hz (174.2°)
2Jbc = Not Predicted
(107.1°) |
Altona Prediction (Hz)
(HLA-Chemical Groups) |
3Jbc =
2.17 Hz (69.6°)
3Jac = 12.78 Hz (174.6°)
2Jab= Not Predicted
(107.1°) |
3Jab
= 2.26 Hz (67.45°)
3Jac = 12.81 Hz (174.2°)
2Jbc = Not Predicted
(107.1°) |
Altona Prediction (Hz)
(DAD-Chemical Groups) |
3Jbc =
12.66 Hz (69.6°)
3Jac = 12.66 Hz (174.6°)
2Jab= Not Predicted
(107.1°) |
3Jab
= 2.28 Hz (67.45°)
3Jac = 12.66 Hz (174.2°)
2Jbc = Not Predicted
(107.1°) |
|
Observed (Hz) |
3Jbc =
6.30 Hz
3Jac = 8.00 Hz
2Jab = 13.3 Hz |
3Jab
= 6.80 Hz
3Jac = 8.20 Hz
2Jbc = 15.5 Hz |
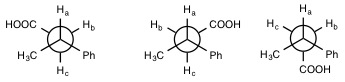
Figure 7. All possible staggered conformations
of PBA.
The coupling constants calculated differ somewhat in the quantitative
results provided depending on which equation was used, but all
give the same qualitative models. However, an important concern
regarding the minimization of the two compounds is that there
are multiple conformations for each compound (each one having
its own dihedral angles), which all partially contribute to the
overall observed coupling constant. Ideally, the students will
minimize and calculate the relative energies of each conformation,
extract their respective dihedral angles, and calculate the coupling
constants of the protons in all conformations (Figure
7). The students will then take a weighted average of the
variety of coupling constants based on their respective stabilities
in order to obtain a more accurate coupling constant prediction.
However, such an endeavor is more time consuming and requires
more knowledge of the software than is feasibly taught in an undergraduate
laboratory experiment.
We elected to focus on the minimization of the entire structure
to explain the presence of diastereotopic protons in the spectra
as a consequence that each compound has three different, minimizable
staggered conformers. In any case, not all the conformations will
contribute equally to the coupling constant and, under the time
constraint for the lab exercise, the 'overall' minimization of
both compounds appeared to be the ideal method to get a clear
idea of their preferred conformations. Therefore the values predicted
for the coupling constants are those calculated from the most
stable conformation for each compound, obtained with a reasonable
level of computation. The 1H-NMR spectra and predictions
gave an appreciable amount of information regarding the partial
structure of the compounds and provided insight into some correlations
and couplings, however other NMR spectroscopy techniques such
as 13C-NMR and APT are needed to continue the structure
elucidation.
Differentiation using 13C-NMR. The differentiation
between the two compounds by comparing 13C chemical
shifts is a difficult task despite using both the chemical shift
prediction method and the actual 13C-NMR spectra. It
is hard to see a clear difference by looking at the stacked 13C-NMR
superimposed plot of both isomers (Figure
8). A few carbon peaks have different chemical shifts, but
the students should ask themselves whether such differences give
a major hint on how to confidently assign the structure of each
isomer? At the second or third year undergraduate level, 13C-NMR
interpretation is mainly focused on the number of carbons present
in the molecule and where these peaks are located in one of the
four regions of the spectra that contain characteristic carbon
peaks: carbonyl groups region, unsaturated and aromatic ring carbons
region, saturated carbons affected by electronegative atoms region,
and saturated carbons unaffected by their surrounding region.
In this case, the 13C-NMR spectra of each compound
will provide the students with the confirmation of the presence
of a carbonyl group (at 178 and 182 ppm), the presence of three
carbons unaffected by any electronegative atoms and a benzene
ring, which was already verified by the 1H-NMR. Other
types of 13C-NMR spectroscopy available to students
are the DEPT and APT experiments. After reading about the strengths
and limitations of each type of experiment, students will have
the choice of picking one technique over the other to further
continue their investigation.
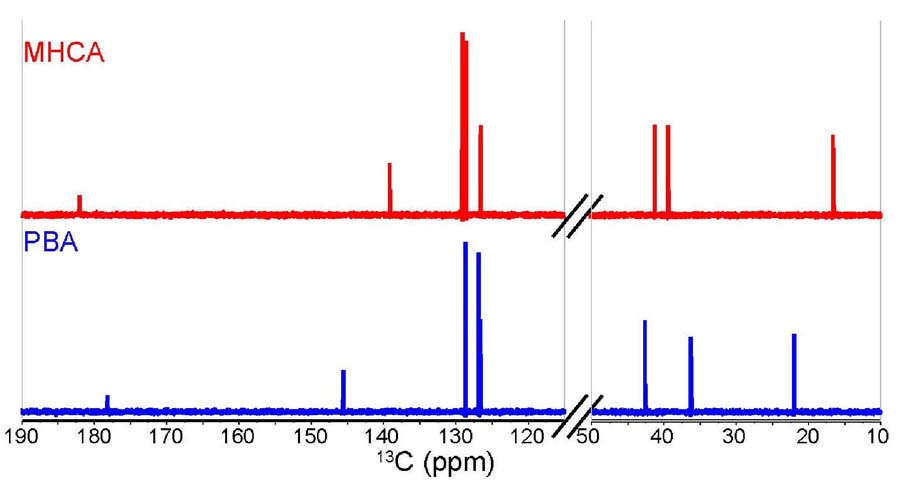
Figure 8. Stacked 13C-NMR spectra of MHCA
(red, top) and PBA (blue, bottom) in CDCl3,
showing relevant regions.
APT and DEPT experiments. Distortionless enhancement
by polarization transfer (DEPT) and attached proton test (APT)
are two different kinds of 13C-NMR experiments. The
APT experiment is simpler than the DEPT experiments, and allows
for the separation of the carbons unattached to protons (quaternary
carbons) and CH2 signals from CH and CH3 signals. There are several types of DEPT experiments:
DEPT-45, DEPT-90, and DEPT-135. In a DEPT-135 experiment, all
carbons in the molecule that are attached to a proton will be
observed; however, the phase (i.e. positive or negative
peaks) of the carbon will differ depending on whether it has an
odd or even number of hydrogen atoms attached. APT, although a
less sensitive technique than the DEPT, is often preferred since
it shows all carbon signals at once, unlike the DEPT experiment
which suppresses quaternary carbons and requires three different
experiments (DEPT-45, -90 and -135) to yield the same result.
The APT spectra of both compounds are very helpful in determining
the different types of carbons present in the molecule (primary,
secondary, tertiary or quaternary). The carbonyl carbon (either
178 or 182 ppm) was reconfirmed, along with the presence of the
quaternary carbon of the benzene ring (either 145.5 or 139.1 ppm).
More information can be extrapolated from the APT spectra, but
it will be suggested to the students that interpreting the APT
and the HSQC spectra side by side will provide more valuable information
and help to save time and energy.
Differentiation using 2D-NMR - 1H-1H
Correlation Spectroscopy (COSY). COSY is one of the most frequent
two-dimensional experiments used by students. This experiment
charts the proton spectrum on the vertical and horizontal axes
which gives rise to a third dimension displaying the intensity
of the overlapping signals. This helps simplify complex spectra
by showing which protons couple together. The student will obtain
a spectrum that consists of peaks that are in a diagonal line
and these peaks will correspond to the same proton peak on each
axis. The cross peaks (off-diagonal peaks) that are found show
the peaks that are correlated together by their spin-spin coupling,
indicating protons that are coupled together [11].
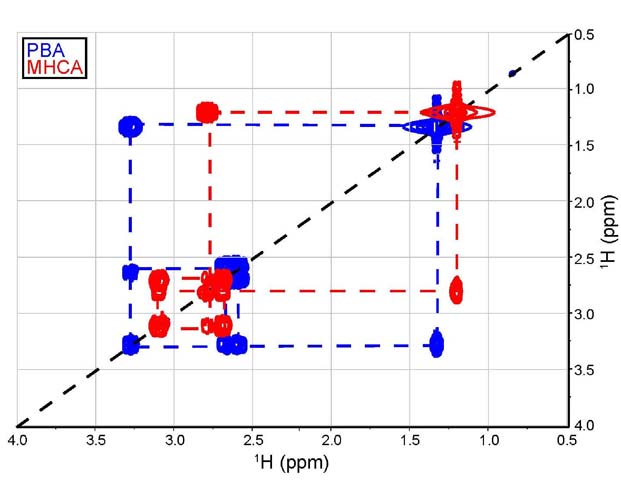
Figure 9. Overlay of truncated COSY spectra (4.0 to
0.5 ppm on both the horizontal and vertical axes) for MHCA (red)
and PBA (blue).
Although valuable, the information extracted from the COSY
spectra on simple molecules, such as PBA and MHCA, is limited
(Figure 9). The aromatic protons are
only coupled to each other as expected in a monosubstituted benzene
ring (spectral region omitted in Figure
9). The interesting part of the spectral analysis is that
the COSY may show, in both cases, the coupling between a methyl
group and methine and a methylene group in the following order:
CH3-CH-CH2-. The
COSY spectrum needs to be further complemented with an HSQC experiment
to prove this potential sequence, as well as to confirm the presence
of diastereotopic protons.
Heteronuclear Single Quantum Coherence (HSQC). HSQC
is a sensitive technique used to identify specific protons that
are attached to specific carbons. Similar to the COSY technique,
HSQC experiments are two-dimensional, with the difference being
that HSQC charts a proton spectrum on one axis and a carbon spectrum
on the other. The cross peaks that result from this experiment
show correlation between the carbon atoms and the specific proton
atoms that are attached. This allows the students to match proton
NMR peaks to their specific carbon NMR peaks, or vice versa, often
helping further assignment of NMR peaks to the corresponding molecule
[11].
Since the APT spectra has already provided the students with
information regarding the different carbon types present in the
molecules, the HSQC will serve as definitive proof of the presence
of diastereotopic protons as they both couple to the same carbon.
For the MHCA spectrum, protons at 3.08 & 2.68 ppm couple with
the same carbon at 39.39 ppm, while for the PBA spectrum, the
protons at 2.58 & 2.68 ppm couple with the same carbon at
41.55 ppm (Figure 10).
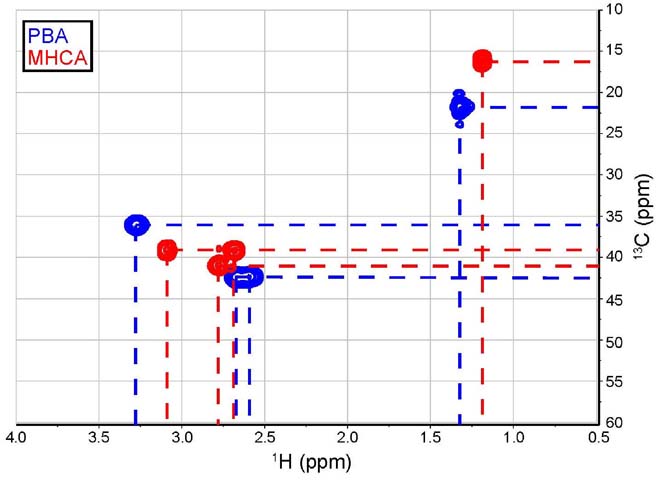
Figure 10. Overlay of truncated HSQC spectra (4.0 to
0.5 ppm & 60 to 10 ppm) for PBA (blue) and MHCA (red).
At this point in the exercise, it is important to allow the
students to write all the possible structures and to provide them
with a chart thereby allowing them to write all the peaks they
have assigned in an effort to limit mistakes or repetition in
their work (Table 3). It is also important
for the students to assign a single set of labels for all carbons
and protons once they have decided on the two possible final structures
to avoid any confusion. Most of the peaks may now be assigned
with the data collected thus far; however, while the data accumulated
will allow for the correct labelling of both molecules, their
differentiation will remain unclear.
Table 3. Summary and mock chart of the information gathered
by the students mid-point through the exercise.
 |
 |
|
1H and 13C chemical shifts
(ppm) |
1H and 13C chemical shifts
(ppm) |
Ha: 10.17 ppm; carbonyl:
178.11 ppm
Hb & Hb': 2.68
& 2.58 ppm; Cb: 42.55 ppm
Hc: 3.28 ppm; Cc:
36.24 ppm
Hd: 1.33 ppm; Cd:
21.94ppm
He: 7.22 ppm; Ce:
126.79 ppm
Hf: 7.31ppm; Cf:
128.65 ppm
Hg: 7.22 ppm; Cg:
126.60 ppm
Ch: 145.50 ppm |
Ha: 11.14 ppm; carbonyl:
182.00 ppm
Hb & Hb': 3.08
& 2.68 ppm; Cb: 39.39 ppm
Hc: 2.77 ppm; Cc:
41.24 ppm
Hd: 1.18 ppm; Cd:
16.59 ppm
He: 7.20 ppm; Ce:
129.09 ppm
Hf: 7.30 ppm; Cf:
128.51ppm
Hg: 7.20 ppm; Cg:
126.52 ppm
Ch: 139.10 ppm |
Most of the peaks can be correctly assigned through careful
analysis of the data despite the presence of a few peaks that
may prove more challenging due to overlapping signals. However,
in order to confidently differentiate the compounds, the students
are to be made aware of another 2D-NMR technique: HMBC.
Heteronuclear Multiple Bond Correlation (HMBC). HMBC
is a sensitive, long-ranged technique that allows the student
to identify specific protons that are attached to specific carbon
atoms. In contrast to the HSQC experiment, HMBC can observe heteronuclear
correlations over several bonds. This enables the students to
ascertain which atoms are in proximity to each other through bonds.
HMBC utilizes a two-dimensional spectrum with a proton spectrum
on one axis and a carbon spectrum on the other. The resultant
cross-peaks show which protons and carbons are attached over several
bonds and show correlations that demonstrate primarily 2JCH and 3JCH
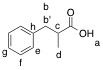
connectivities [11]. The possible
couplings observed in an HMBC spectrum and the expected/predicted
couplings for PBA and MHCA are shown in Figure
11. HMBC spectra may seem overwhelming at first due to its
multitude of couplings; however, it can become an easy task if
the instructor ensures that the students make several predictions
of expected cross-peaks to see before embarking on the interpretation
of the spectra. With the instructor's advice, the students will
start their interpretation from a well-defined set of peaks in
their spectra. In both the MHCA and PBA compounds, the diastereotopic
protons will offer an ideal starting point.
Figure 11. Possible HMBC coupling observed for the diastereotopic
protons in MHCA with 5 possible couplings (left) and in PBA with
4 possible couplings (right). The centre figure demonstrates how
the proton on the methine group can either 2JCH or 3JCH
couple to adjacent carbons through bond.
The difference between the HMBC spectra, albeit subtle, is
clearly shown, as there are 5 couplings in the case of MHCA versus
4 couplings in the case of PBA (Figure
11). Combined with all the previous findings, this analysis
aids in the assignment of the structures to their corresponding
spectra. The superimposed PBA and MHCA HMBC spectra show all the
diastereotopic protons couplings present in the molecules and,
in the MHCA spectra, the presence of the extra interaction (shown
in the dashed rectangle) thus putting the differentiation
problem to rest (Figure 12).
In addition, a three-bond coupling between the methyl protons
(Hd, δ = 1.18 ppm) and the carbonyl
carbon (Ca, δ = 182.00 ppm) may be
predicted in the MHCA spectrum. This is not seen for PBA because
the methyl hydrogen (Hd, δ = 1.33
ppm) to carbonyl carbon (Ca, δ =
178.11 ppm) coupling would have to occur across four bonds, which
is only expected in conjugated systems. Upon analysis of the HMBC
spectra, a cross signal between the methyl protons and the carbonyl
carbon is observed in the MHCA spectrum and is absent in the PBA
spectrum. Furthermore, a three-bond coupling between the methyl
protons (Hd, δ = 1.33 ppm) and the
quaternary aromatic carbon (Ch, δ
= 145.50 ppm) is found in the PBA spectrum but not the MHCA spectrum
as it would correspond to a four-bond coupling between the methyl
protons (Hd, δ = 1.18 ppm) and the
quaternary aromatic carbon (Ch, δ
= 139.10 ppm).
The above technique shows a clear difference between MHCA and
PBA. At this point, the students should be exposed to mass spectrometry
and fragmentation patterns as additional techniques to validate
their structures and spectral assignments.
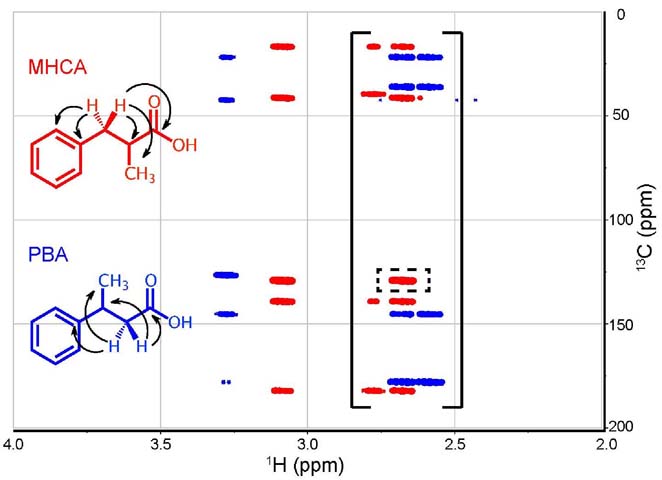
Figure 12. Superimposed truncated HMBC (4.0 to 2.0 ppm
& 200 to 0 ppm) spectra for PBA (blue) and MHCA (red) with
labelled observed couplings. The solid brackets show the
diastereotopic protons coupling peaks present in both molecules,
while the dashed rectangle shows the extra coupling present in
MHCA.
Differentiation using mass spectrometry fragmentation patterns.
When the students have exhausted the NMR techniques available
to them, they will need to confidently confirm their structure
determination by utilizing mass spectrometry. The students should
be reminded here that, generally speaking, more than one analysis
is needed to prove structures and that it is always better to
collect more evidence to substantiate their argument. In general,
the first mass spectrometry techniques undergraduate students
are exposed to are chemical ionization and electron ionization
mass spectrometry, with each technique having its advantages and
limitations.
Chemical Ionization - Mass Spectrometry (CI-MS): While
this method is an informative method to visualize the molecular
ion (M+H+ = 165) for both isomers, it is not a very
useful technique for structure elucidation as CI-MS fragmentation
patterns are often difficult to interpret [1-4].
Electron Ionization - Mass Spectrometry (EI-MS): This
is a second mass spectrometry technique that demonstrates a clear
difference between the two isomers. When both spectra are recorded,
the same molecular ion is observed for both compounds (m/z
=164) while the base peaks for each compound are dramatically
different (m/z = 91 and 105). The compounds also shared
an identical fragment with an m/z of 118 (Figure
13).
With the molecular ion present in both spectra, the students
should focus on the fragmentation patterns of both compounds.
To understand the fragmentation pattern of these molecules, a
close look at the parent molecule, 3-phenylpropanoic acid, and
its fragmentation peaks and patterns was necessary. The main fragment
for 3-phenylpropanoic acid and its ester had an m/z of
104, which corresponds to the well-documented expulsion of formic
acid or methyl formate [12, 13].
The common peak at m/z of 118 is also due to the expulsion
of formic acid (loss of 46) observed in the PBA and MHCA spectra.
The base peaks for both compounds can be rationalized using the
well-documented fragmentation of benzene derivatives (e.g.
toluene and cumene), where the formation of the benzyl cation
spontaneously rearranges to the tropylium (cycloheptatrienyl)
ion (m/z = 91). When the side chain attached to the benzene
immediately branches, as in the case of PBA, the formation of
the methyltropylium ion is observed (m/z = 105). Another
advantage from observing the formation of the tropylium or methyltropylium
ions is that these ions both exhibit characteristic fragmentations
of their own through the loss of an ethyne moiety. This results
in a commonly observed peak corresponding to either the cyclopentadienyl
(m/z = 65) and methylcyclopentadienyl (m/z = 79)
cations in the spectra of substituted benzene rings (Figure
14).
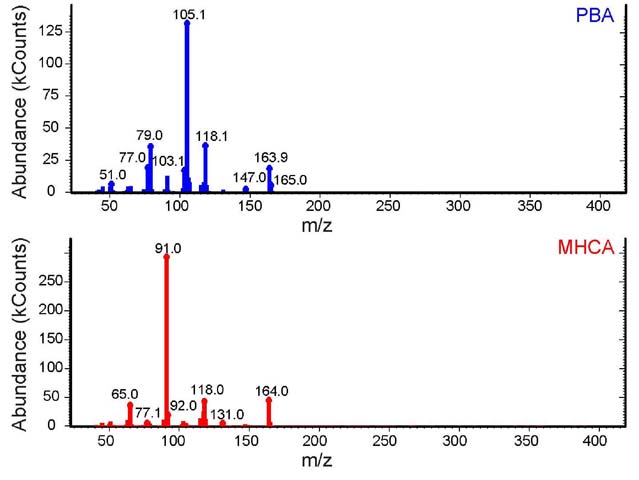
Figure 13. Stacked EI-MS spectra of PBA (blue, top)
and MHCA (red, bottom).
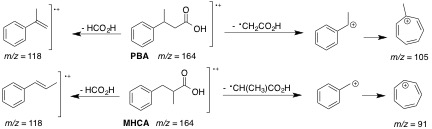
Figure 14. Observed fragments for PBA (top) and MHCA
(bottom) in EI-MS [14,15].
Conclusion
Through the identification and differentiation of the simple
molecules of 3-phenylbutyric acid and α-methylhydrocinnamic
acid, students are shown the limitations of routine undergraduate
characterization experiments, such as techniques using infrared
spectroscopy, and several 1D- and 2D-NMR techniques. The difficulty
in distinguishing between the two 'simple' compounds facilitates
the introduction of mass spectrometry and the more complex HMBC
NMR experiment. Due to the relative simplicity to explain and
carry out these techniques in an undergraduate course, this case
study is recommended to introduce more advanced characterization
techniques to undergraduate students early on in their studies.
This exercise also has the benefit of exposing students to a practical,
realistic problem they may encounter in their chemistry careers.
Acknowledgements
We would like to thank the Simon Fraser University chemistry
department for its financial and logistical support. We would
also like to thank Dr. Charles Walsby for his help with the minimization
softwares, and Dr. Hamel Tailor for the critical reading of the
manuscript.
Supporting
Materials: Complete processed spectral data for
both compounds are provided in the supplementary material as pdf
files. The NMR FIDs are available from the corresponding author:
nmerbouhsfu.ca.
References
1. Pavia, D. L.; Lampman, G. M.;
Kriz, G. S.; Vyvyan, J. R., "Introduction to spectroscopy,
5th ed.", Brooks/Cole, Belmont (CA), 2009.
2. Silverstein, R. M.; Webster, F.
X.; Kiemle, D. J., "Spectrometric identification of organic
compounds, 7th ed.", John Wiley & Sons, Hoboken (NJ),
2005.
3. Lambert, J. B., "Organic structural
spectroscopy", Prentice Hall, Upper Saddle River (NJ), 1998.
4. Crews, P.; Rodríguez, J.;
Jaspars, M., "Organic structure analysis", Oxford University
Press, New York, 1998.
5. Breitmaier, E., "Structure
elucidation by NMR in organic chemistry: a practical guide. 3rd
rev. ed.", Wiley, Chichester (England), 2002.
6. Haasnoot, C. A. G.; Deleeuw, F.
A. A. M.; Altona, C., Tetrahedron, 1980,
36 (19), 2783-2792.
7. Donders, L. A.; Deleeuw, F. A. A.
M.; Altona, C., Magn. Reson. Chem., 1989, 27 (6),
556-563.
8. Altona, C.; Ippel, J. H.; Hoekzema,
A. J. A. W.; Erkelens, C.; Groesbeek, M.; Donders, L. A., Magn.
Reson. Chem., 1989, 27 (6), 564-576.
9. a) Dihedral angles were calculated
using the Gaussian-09W electronic structure program, May 2011.
b) Navarro-Vazquez, A.; Cobas, J. C.;
Sardina, F. J.; Casanueva, J.; Diez, E., J. Chem. Inf. Model.,
2004, 44 (5), 1680-1685.
10. Cookson, R. C.; Crabb, T. A.; Frankel,
J. J.; Hudec, J., Tetrahedron, 1966, 7, Suppl.
355-390.
11. Miller, V. R., "Use of HSQC,
HMBC, and COSY in Sophomore Organic Chemistry Lab", in: Soulsby,
D.; Anna, L. J.; Wallner, A. S., editors, "NMR Spectroscopy
in the Undergraduate Curriculum", American Chemical Society,
2013, p. 103-128 (ACS Symposium Series, vol. 1128).
12. Ballantine, J. A.; Curtis, R. F.,
Org. Magn. Res., 1970, 3, 1215-1217.
13. Rosca, S. I.; Stan, R.; Ungureanu,
E. M.; Stanciu, G.; Rosca, S., U.P.B. Sci. Bull., Series B.,
2008, 70, 77-84.
14. Resink, J. J.; Venema, A.; Nibbering,
N. M. M., Org. Mass. Spectrom., 1974, 9 (10),
1055-1058.
15. Amick, A. W.; Hoegg, E.; Harrison,
S.; Houston, K. R.; Hark, R. R.; Reingold, I. D.; Barth, D.; Letzel,
M. C.; Kuck, D., Int. J. Mass. Spectrom., 2012,
316, 206-215.
16. Bruice, P. Y., "Organic chemistry.
7th ed.", Pearson/Prentice Hall, Upper Saddle River (NJ),
2014.
Appendix: Useful Definitions
[1,16]
- Constitutional/structural isomers: molecules that have
the same molecular formula, but different connectivity of their
atoms.
- Diastereotopic protons/hydrogens: two hydrogen atoms
bonded to a single carbon
atom that when one hydrogen is replaced with a deuterium, result
in a pair of diastereomers.
- Roof/leaning effect: a second-order NMR spectra effect
in which, when two peaks are
strongly coupled, the intensities of the peaks in a NMR signal
are tilted upwards in the
direction towards the NMR peak that it has the coupled spin.
- Second-order spectra: strong coupling effects most commonly
observed when the
chemical shifts between two groups of protons are similar to the
magnitude of the
coupling constant between them.